< Back
Intensifier Control
LIFA Software
Dedicated software to record and analyze fluorescence lifetime images.
Description
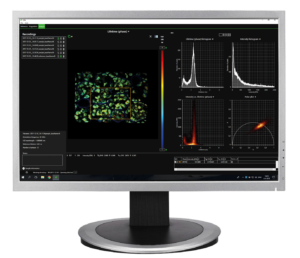
Our LIFA software guides you through your FLIM experiments from start to finish, seamlessly integrating all Lambert Instruments hardware. This allows you to focus entirely on your experiment, while the software handles the recording of FLIM data and instantly calculates the fluorescence lifetime.
FLIM Settings
Live View images display the impact of each setting on the resulting image. Once configured, single or multiple image acquisitions can be recorded or saved as a snapshot.

Light-Source Control
Switching between wavelengths is effortless with the Lambert Instruments Multi-LED and Multi-LASER. Both are seamlessly integrated into the LIFA software, allowing you to switch with just a single click

Time-Lapse
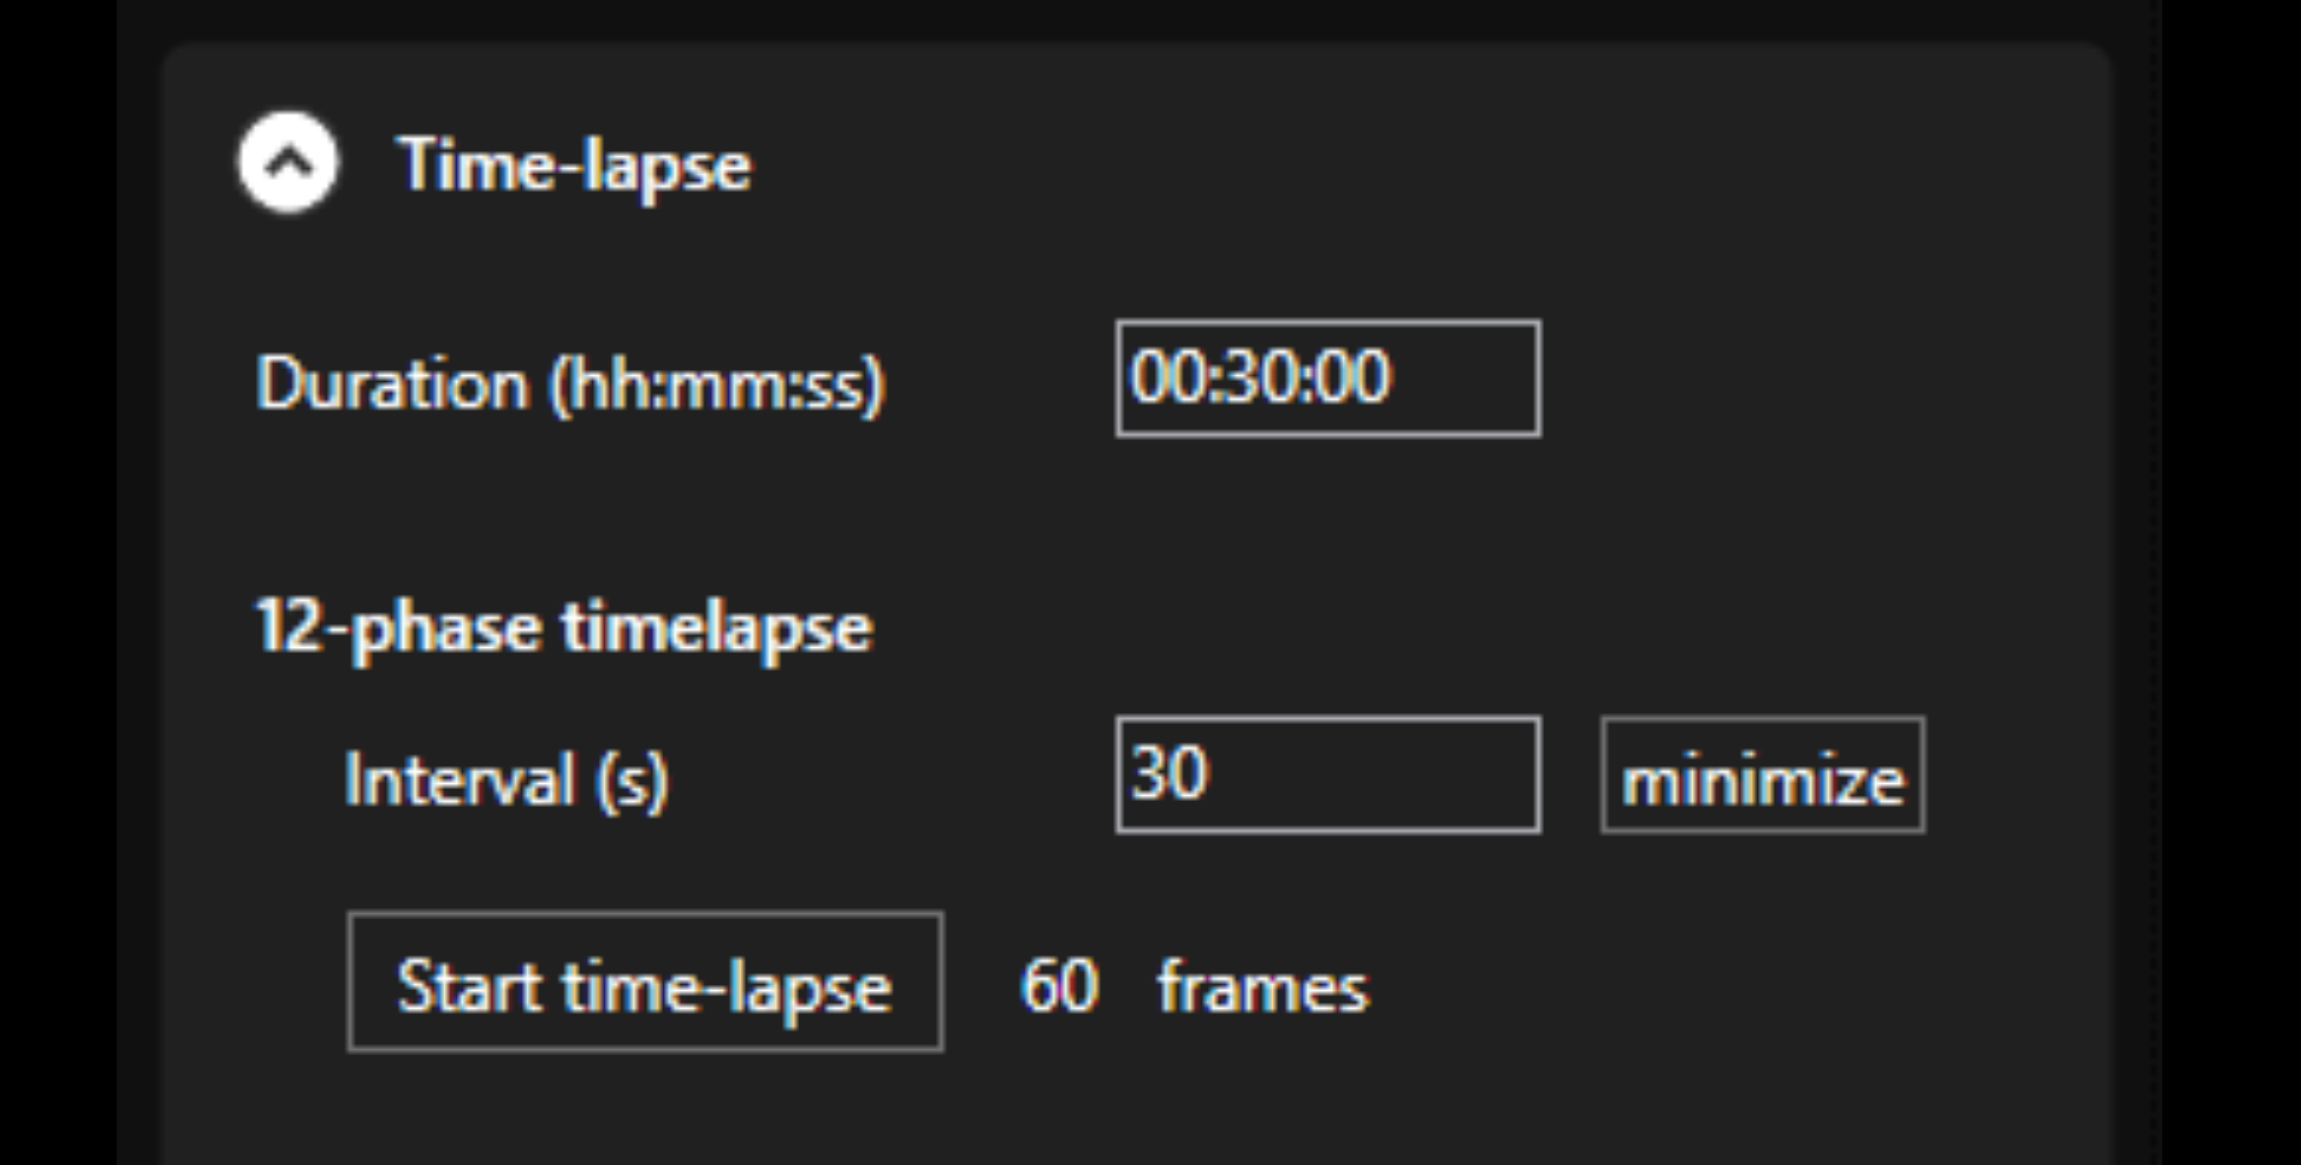
Follow changes in lifetime with time-lapse. Simply enter the duration and the interval between lifetime images and results are immediately displayed in the image viewer and graphs.
Data Analysis
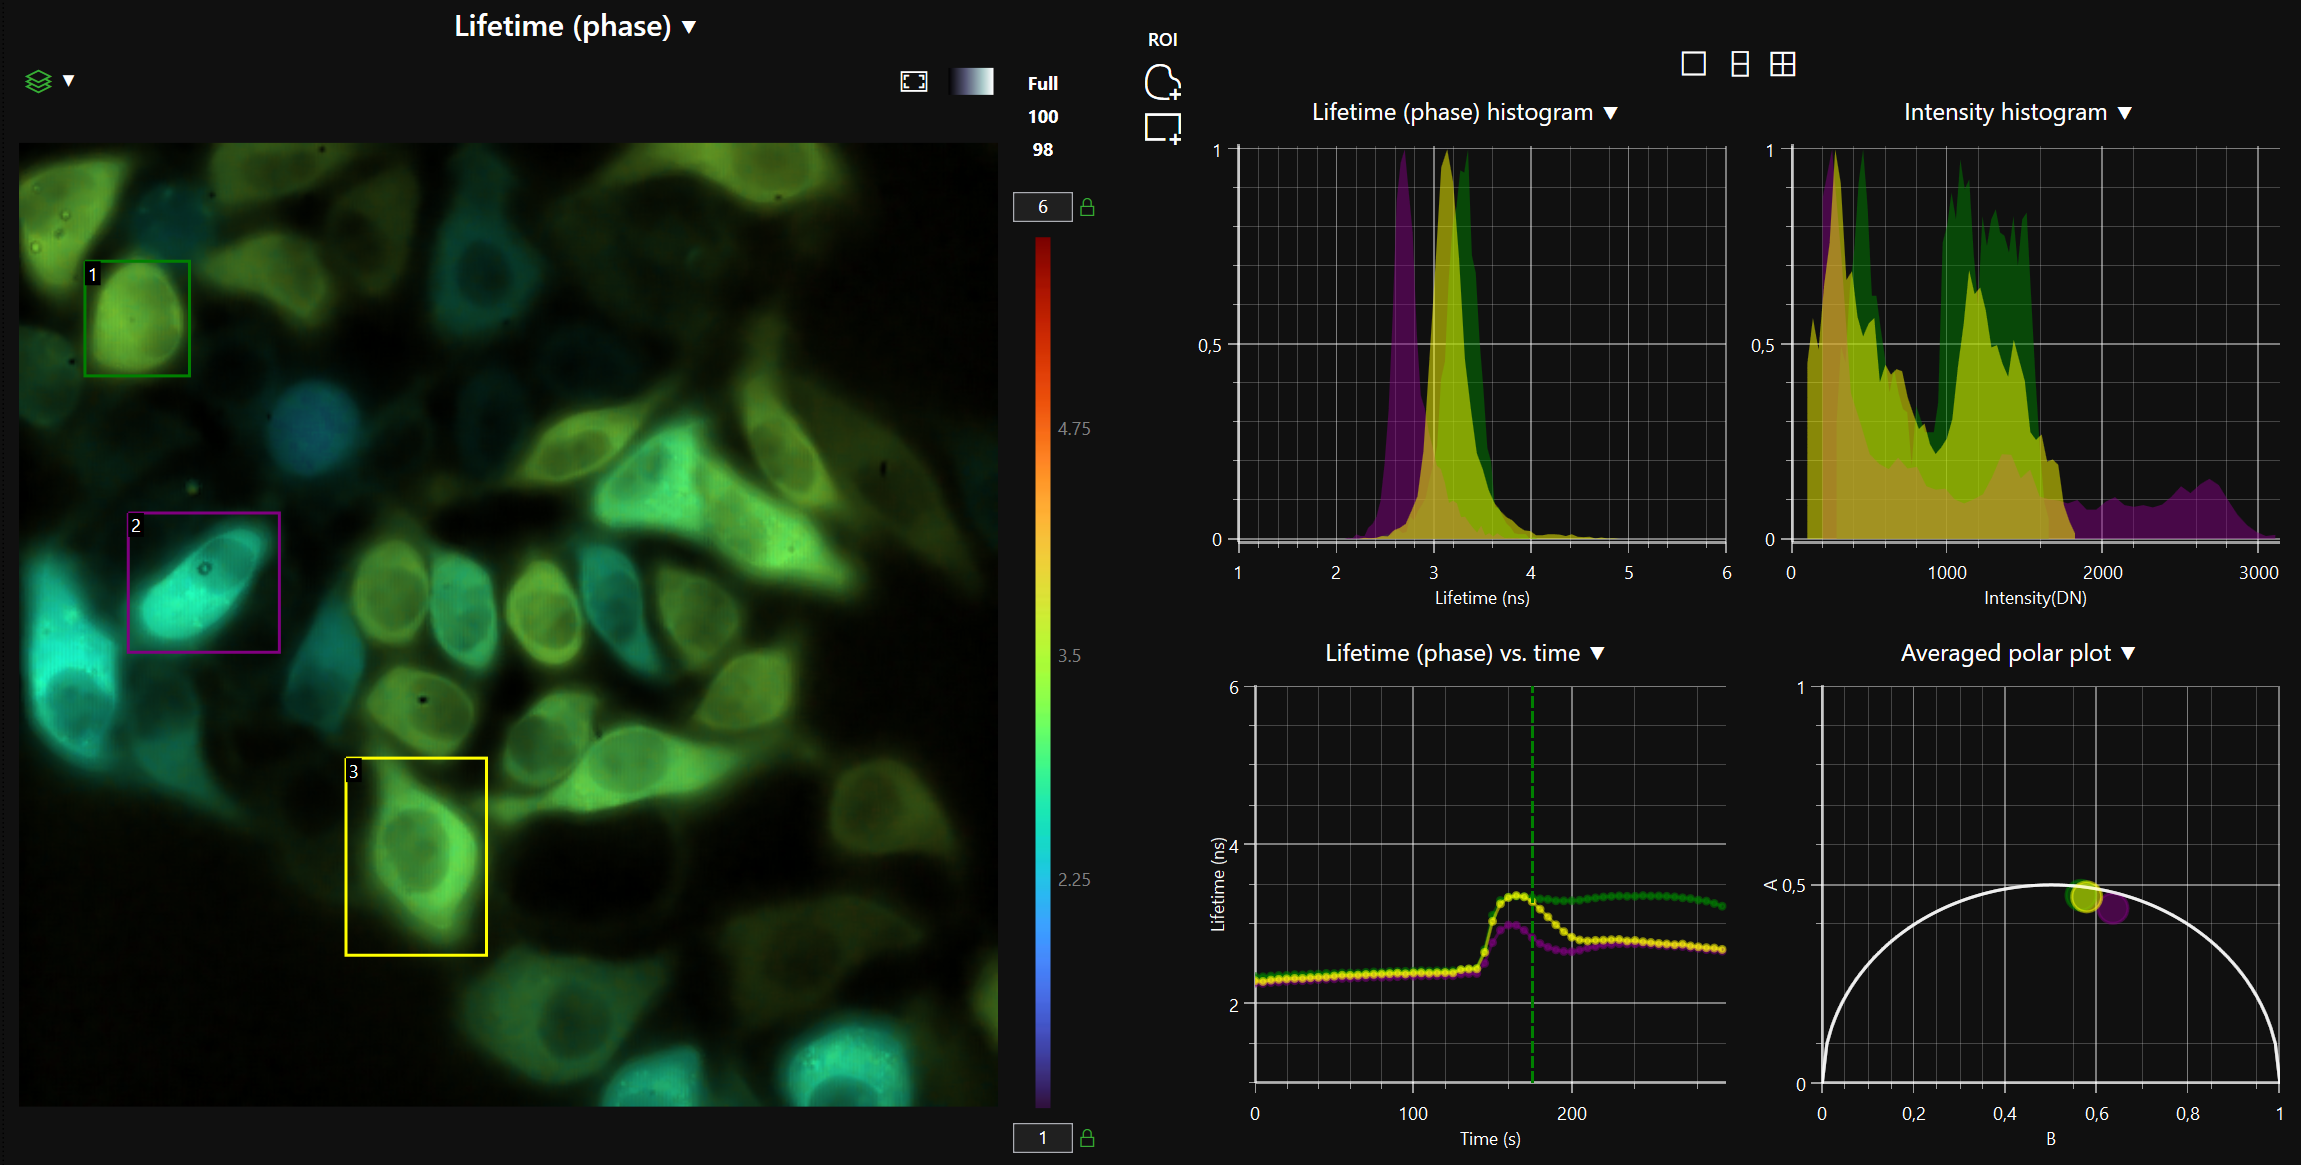
With automatic lifetime calculation and visualisation, data analysis is a breeze. You can overlay the lifetime as a pseudo-colour on the image of your sample or use one of the built-in graphs, which are updated continuously during image acquisition. Choose between displaying one, two or four different graphs.
Lifetime Overlay
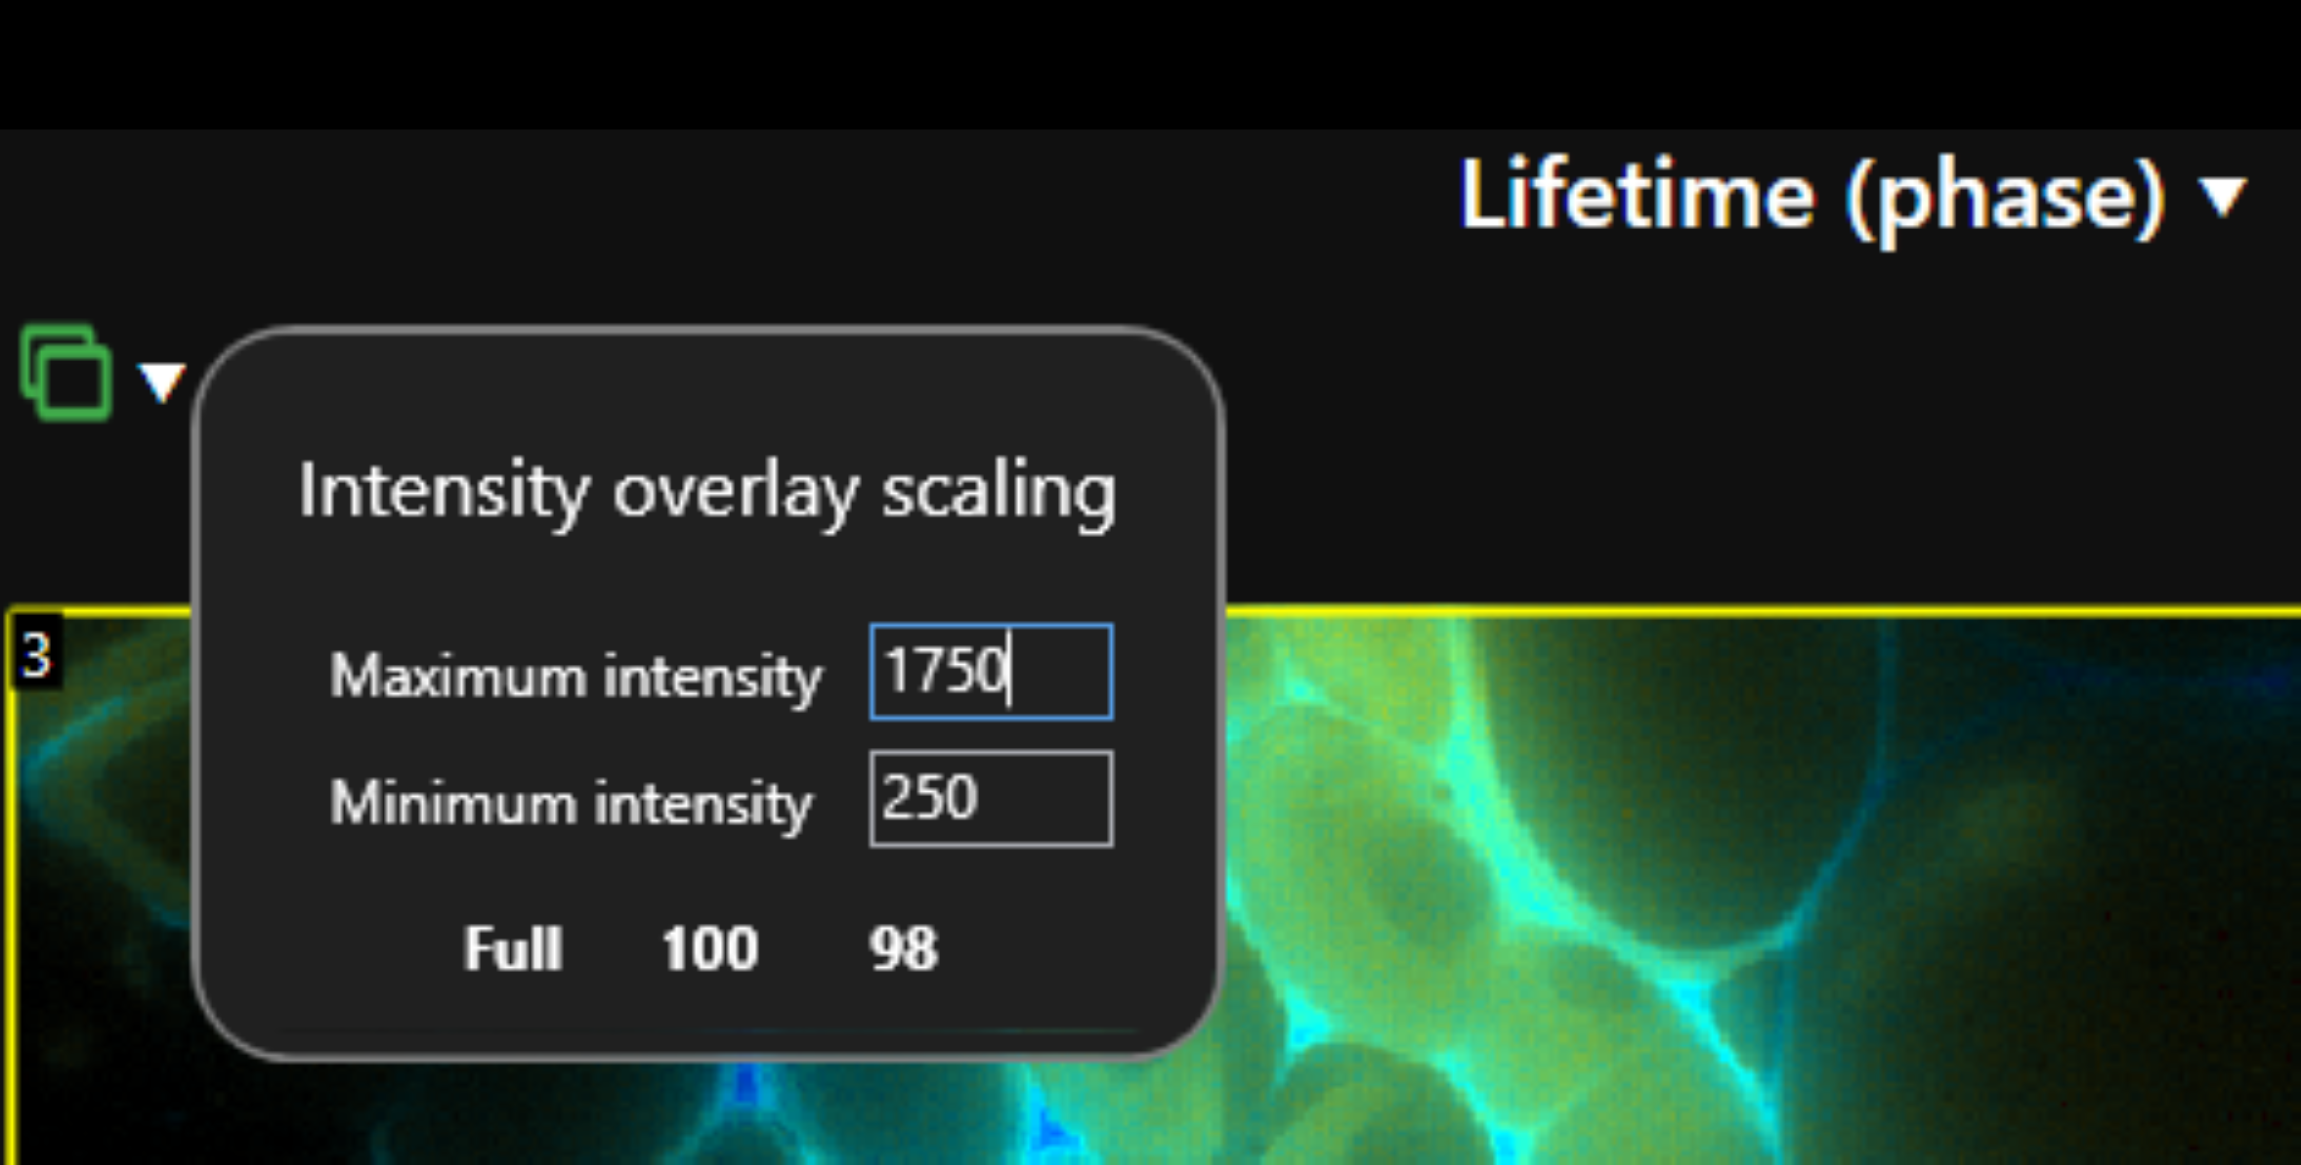
Visualise the fluorescence lifetime with a pseudo-colour overlay on your sample. You can use the automatic overlay settings or manually adjust the colour overlay parameters to suit your needs.
Scatter Plot
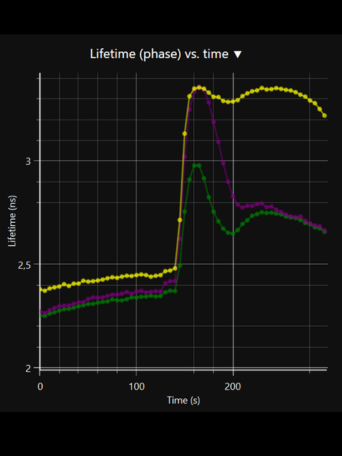
Scatter plots show how a value changes over time or as a function of another quantity; especially useful for illustrating changes in a lifetime time-lapse.
Histogram
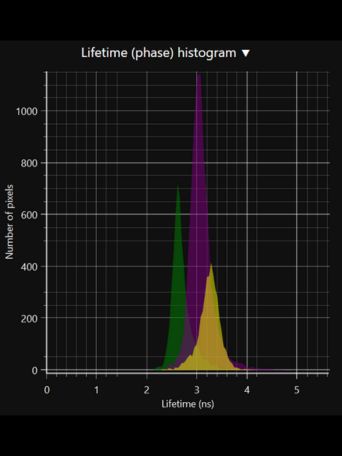
Histograms are useful for a quick overview of the values that are present in your sample and how they are distributed. The histogram chart in LIFA can show lifetime or light intensity.
Phasor Plot
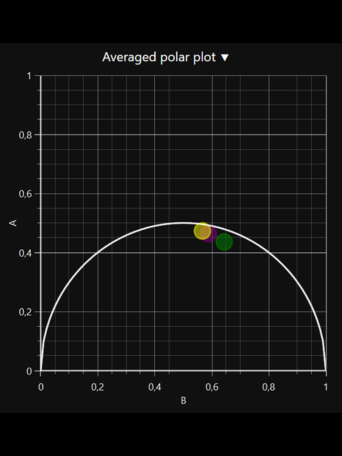
The phasor plot combines information from both phase and modulation to visualise the contribution of multiple lifetime components in your sample.
File Format
The Lambert Instruments file format (.fli) is compatible with Bio-Formats. This means you can open .fli files in analysis programs like ImageJ, CellProfiler, and Matlab.

FIJI/ImageJ

BioFormats
LIFA API
The LIFA software offers an Application Programming Interface (API) that automates many functionalities, enabling endless possibilities for integration with various hardware and software. The LIFA API .Net Assembly can be used in combination with many software platforms, including:
Request software development kit (SDK)
Compatible Hardware
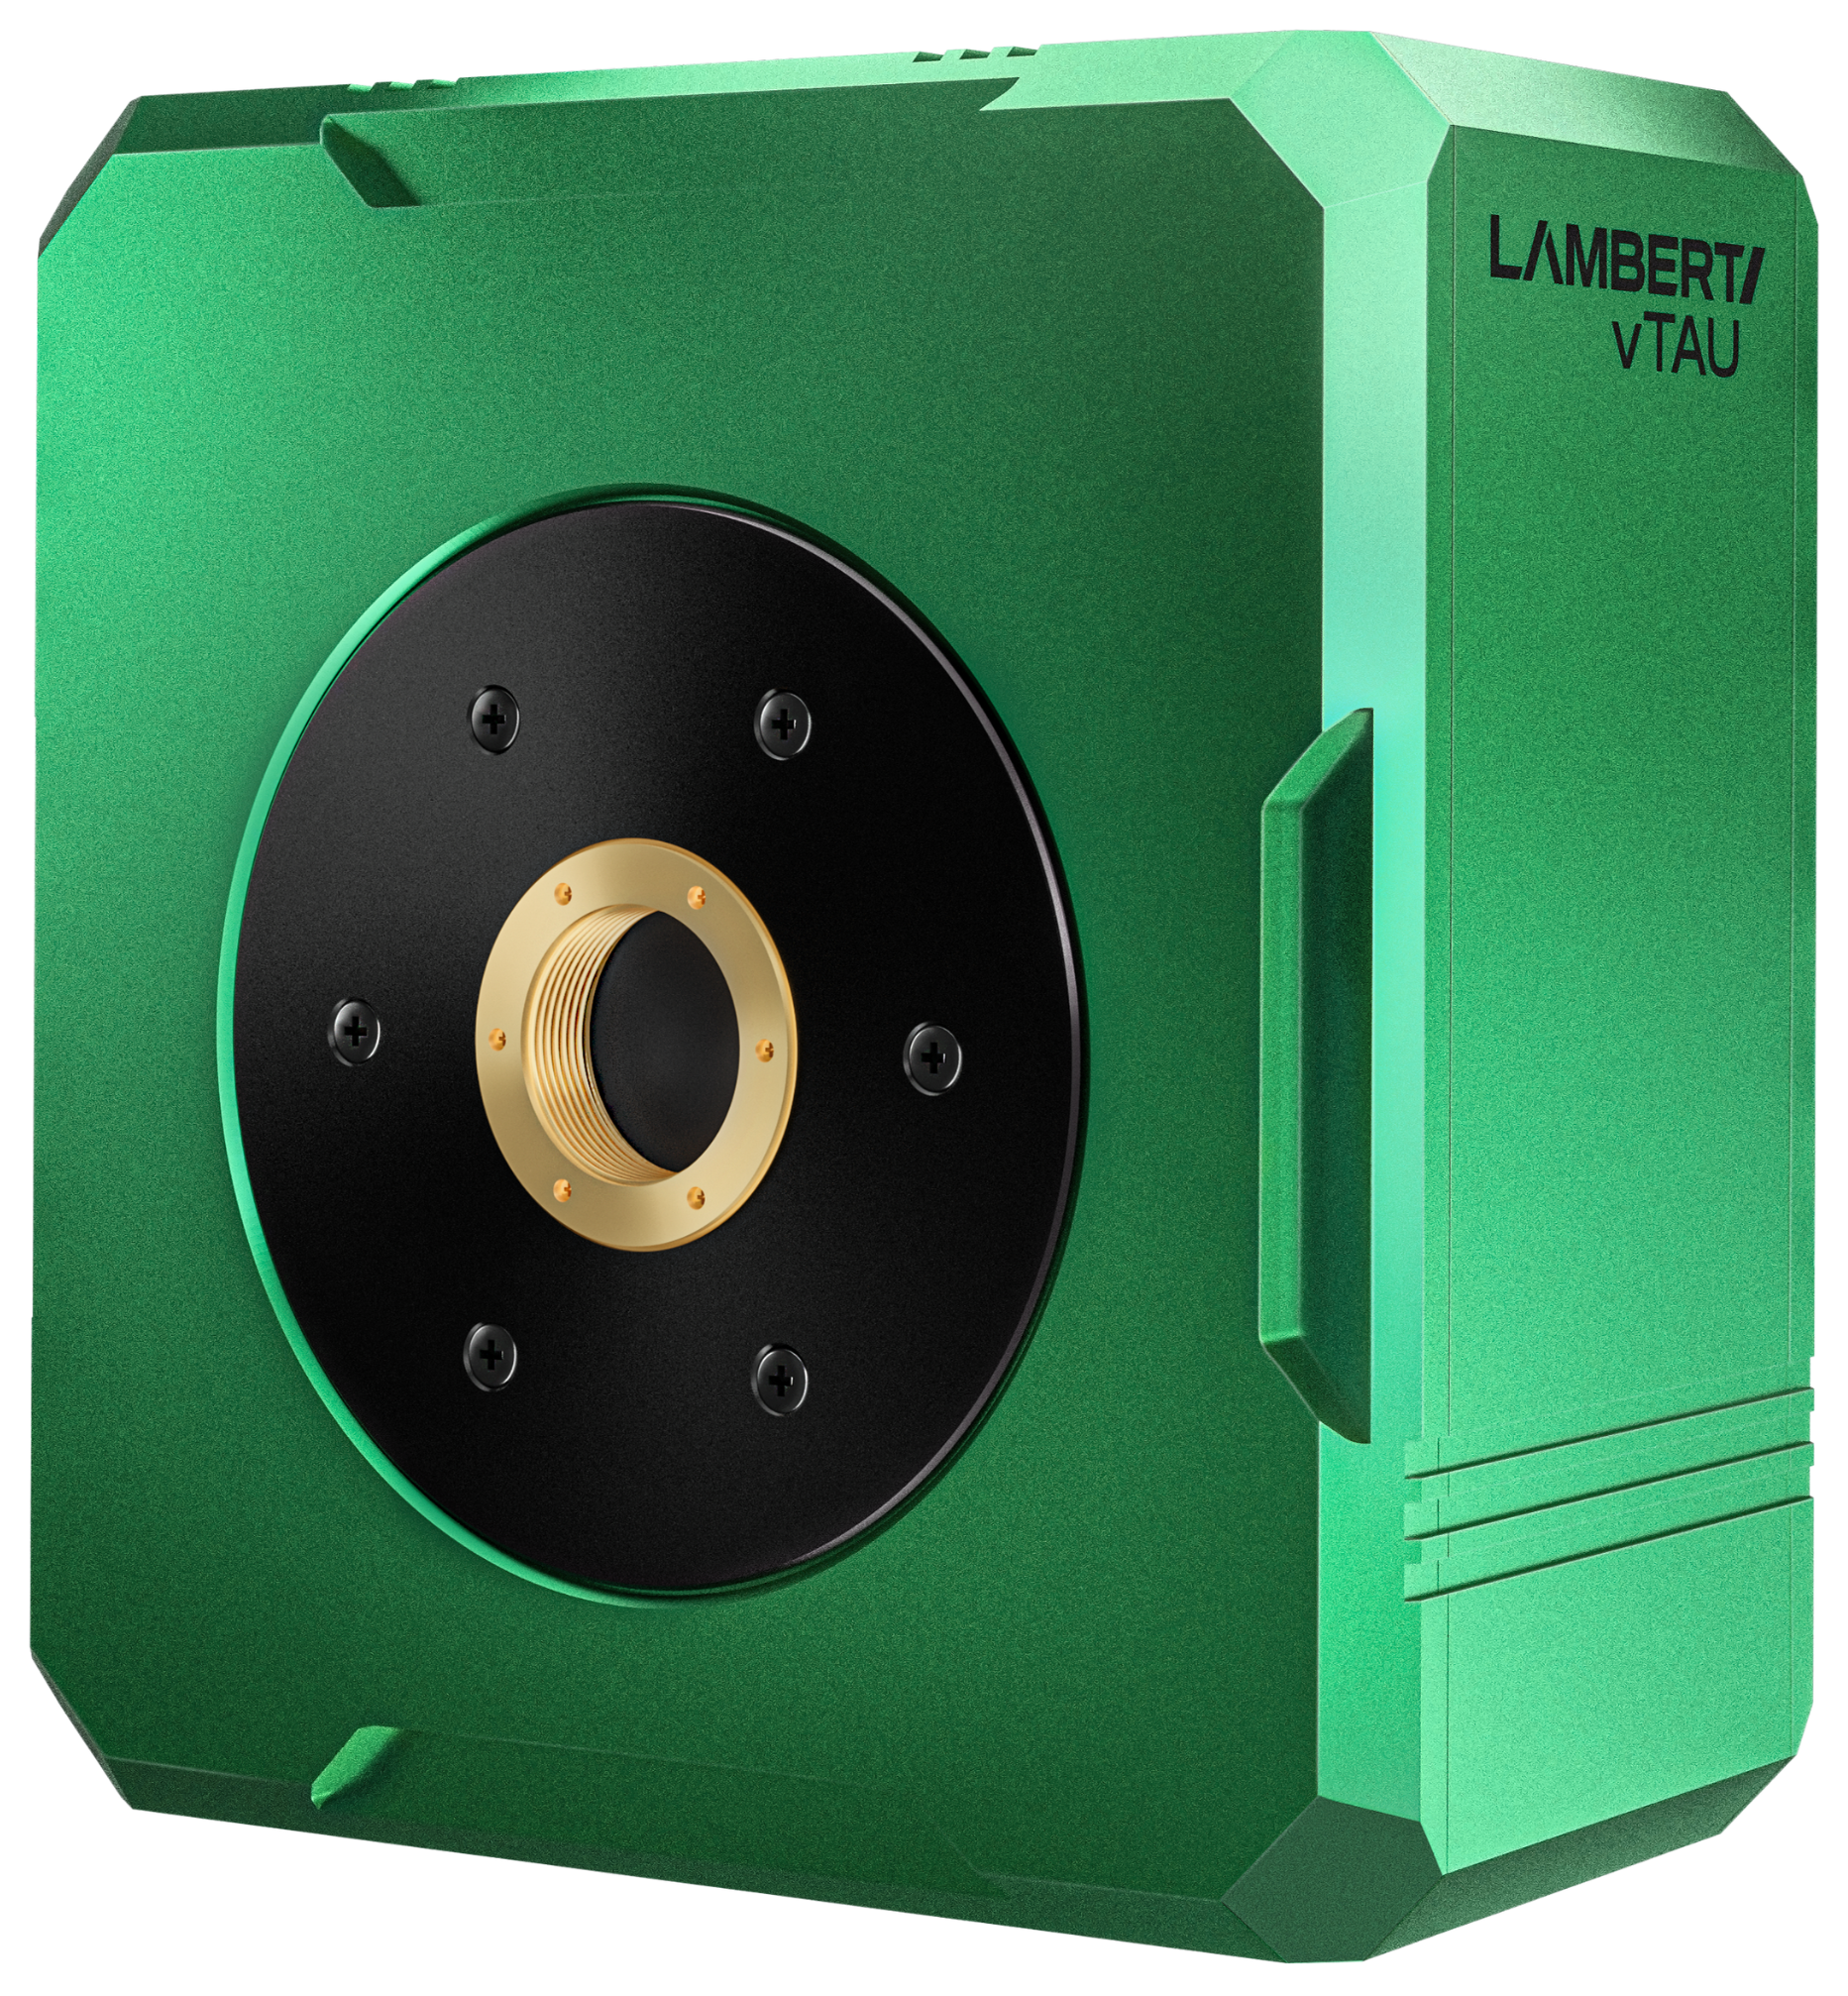
LIFA FLIM
The Lambert Instruments LIFA system is the fastest and easiest way to perform Fluorescence Lifetime Imaging Microscopy (FLIM).
View ProductRequest more information
Lambert Instruments BV
Leonard Springerlaan 19
9727 KB Groningen
The Netherlands


