

What reference should I use?
The perfect reference is a uniform fluorescing sample (e.g. solution of fluorophores), containing fluorophores that have a mono-exponential lifetime, are excited at the same wavelength and emit with the same wavelength as the sample, and do not bleach. We recommend 1 micromolar fluorescein solution pH 10 (4.00 ns) or erythrocine solution (86 ps) for GFP samples and 10 micromolar fluorescein solution pH10 (4.00 ns) for CFP samples.
Please make sure that your reference can be excited at the same excitation wavelength as your sample. Most ideal is to get similar intensity values for the reference stack as for the sample stack. It is highly recommended that you keep the MCP gain of the image intensifier and the LED DC current the same during the reference and sample acquisitions. To get similar intensity values, you can change the exposure time, use ND filters, or change the concentration of your reference solution.
What does phase lifetime mean?
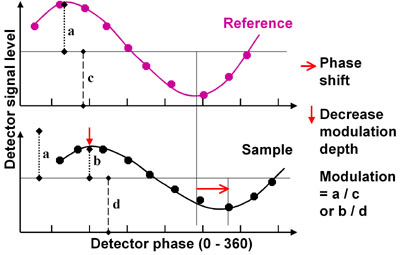
From the phase shift between the excitation and emission light, an estimate of the fluorescence lifetime can be calculated. This estimate assumes that the fluorescence lifetime distribution is mono-exponential. For definitions and more information please refer to ‘Principles of Fluorescence Spectroscopy’ by J.R. Lackowicz, Chapter 5.
What does modulation lifetime mean?
From the modulation depth decrease between the excitation and emission light, an estimate of the fluorescence lifetime can be calculated. This estimate assumes that the fluorescence lifetime distribution is mono-exponential. For definitions and more information please refer to ‘Principles of Fluorescence Spectroscopy’ by J.R. Lackowicz, Chapter 5.
Why does the phase lifetime differ from the modulation lifetime?
The lifetime from phase and modulation are the same only if all the fluorophores behave according to a single exponential decay. In this case we speak of a mono-exponential fluorescence lifetime distribution and the lifetime calculated from the phase shift and the lifetime calculated from the modulation depth are in this case identical. In case of multi-exponential lifetime distributions, the lifetimes calculated from the phase shift and from modulation depth will be different because the equations on which the lifetimes are based assume mono-exponentiality. The more exponents the more both lifetimes differ. For FRET or for tracking lifetime changes the lifetime from phase can be taken to determine the changes in lifetimes.
For multi-exponential distributions, a multi-frequency recording can be used and the phase and modulation behaviour can be fitted with a multi-exponential model, in a similar way as in time domain FLIM (TCSPC). This allows one to retrieve multiple lifetime components and their relative fractions.
How should I start up and shut down the setup?
On startup, first make sure all the hardware cables (power and USB) are connected. Then turn on the LIFA control unit, and start up the LI-FLIM software.
For shutdown first close the LI-FLIM software and then turn off the LIFA control unit. Make sure that when you are done, you switch the microscope port from camera port back to eyepiece, to prevent unwanted light reaching the intensified camera. Turn off the mains power.
Which settings should I use?
Typical settings are: 100 milliseconds of exposure time per phase frame, 100 mA LED DC for LED power. In ‘Expert mode’ it is possible to change the modulation properties of the camera (Cathode DC and AC level) and of the light source (LED DC and AC level), however for normal use these values do not need to be changed. During the LIFA support or LIFA advanced training session the modulation settings are checked.
It is always good to start with a color map of the camera in absolute scale (by pressing the ‘A’ in the menu bar of the imaging window). Subsequently increase the MCP with 50-100 Volts and check if there is signal on the camera. If signal does not appear please use the ’98’ color scale and play with the phase slider (LIFA Control window). Once there is signal one should move the phase slider to the setting producing the highest intensity (the “maximum phase”), subsequently one can scale back to absolute color scale and increase exposure time. For the best possible lifetime accuracy please make sure that the intensity in the ‘maximal phase’ image reaches a value close to the maximum of the 16 bit range.
Note that when the exposure time is set higher than 330 milliseconds, the intensity will not increase accordingly in live video mode as live mode acquisition is limited to 330 ms. To check the result of the requested integration time, press snapshot (in Expert mode). Please know that once you have pressed snapshot, the camera is still active, thus to turn it off one should press the Idle button.
Typically 12 phase images are taken for acquisition of a phase stack, without averaging. Averaging yields a lower standard deviation. A lower MCP can also yield a somewhat lower standard deviation.
Do the quantum efficiency, absorption coefficient and concentration of my sample affect the calculated lifetimes?
There are two ways to calculate the fluorescence lifetime. The quantum efficiency (Q), absorption coefficient (A) and concentration (C) of your sample will not affect the outcome of either method. This is because these characteristics alter the light intensity, which is not a factor in the lifetime calculations.
When calculating the fluorescence lifetime from the phase, only the shift in phase between the excitation and emission light is taken into account. The amplitude of the modulated light intensity does not affect the phase shift.
The fluorescence lifetime calculated from the demodulation (M) is also not influenced by the quantum efficiency, the absorption coefficient or concentration of your sample. These factors determine the light intensity emitted by the sample:
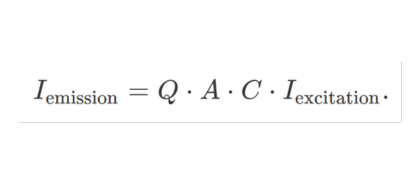
A lower quantum efficiency, absorption coefficient or concentration results in a lower intensity of the emitted fluorescence light. This affects the average light intensity of the modulated light as well as the amplitude of its variation by the same amount. The modulation (m) is the ratio of the variation of the light intensity (a and b in the figure above) to its average (c and d in the figure):
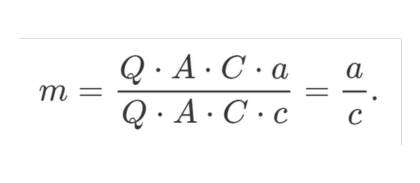
The quantum efficiency, the absorption coefficient and the concentration affect the variation and the average by the same amount. These factors cancel in the calculation of m and are therefore of no influence to the lifetime calculated from the demodulation.
How do I perform a measurement?
Start with your sample and choose the modulation frequency. Then use the LIFA in live mode (‘FLIM’) to set the camera gain and exposure time. Change the phase to get a first impression of the sample modulation depth. Once the camera is setup correctly, one can switch the sample for the reference and take first a reference stack and then proceed with the sample for taking sample stacks. It is good practice to take another reference after your sample acquisition(s) to verify the lifetime stability of the setup. Typically, the measured lifetimes using the different references should be within 10-30 ps. Make sure that you have collected enough samples taken to be able to perform your statistics on the (average) lifetimes you have measured. Please see the LI-FLIM manual for more information (Help > Documentation).
The calculated lifetimes are different from what I expected
Are you using the right fluorescence filter cube?
Are you using the right reference solution and reference lifetime for calibrating the system? Did you change anything in the optical setup between taking a Reference and a Sample? Please note that each optical setup requires its own reference calibration; i.e. switching dichroics, filters, objectives, light source, magnifications, or power light levels changes the path lengths inside the system. The same holds when using a different MCP gain for the intensified CCD camera. Changing ND filters or the exposure time does not require a different reference calibration.
Is there reason to believe that the (photophysics of) your sample is as expected?
Is there auto-fluorescence influencing the fluorescence lifetime distribution?
In case your application is FRET; is there leak-through from your acceptor in the donor channel?
Which factors can influence my FLIM measurements?
Lifetime imaging microscopy often involves performing delicate experiments, such as the detection of protein-protein interactions inside cells, or dynamics of certain proteins. Fluorescence decay can be influenced by many factors in the micro-environment, and each factor should be considered carefully.
CONCENTRATION
For diluted, non-interacting chromophores, fluorescence lifetimes are independent of the chromophore concentration, and this is actually one of the major advantages of the FLIM techniques in quantification of e.g. FRET. [1] and oxygen imaging.
However, significant concentration-dependent quenching is possible. For example, a shortening of the CFP fluorescence lifetime was observed in cells expressing simultaneously the YFP acceptor. This probably reflects primarily intermolecular energy transfer between unlinked CFPs and YFPs. But also in the absence of YFP acceptors this quenching was observed, which might be attributed to pseudo-homo-FRET. [1]
Homo-FRET may lead to significant perturbations of the measured fluorescence decay, if different sub-populations of the chromophore are associated to slightly shifted emission spectra, which we know is actually the case for purified CFP. Therefore, it is called pseudo-homo-FRET. In this situation, energy transfer will preferably take place from the blue emitting sub-populations, and will lead to a specific decrease in the apparent fluorescent lifetimes determined on the blue edge of the emission spectrum (<495nm emission). This decrease in fluorescence lifetime will be maximum if the collected fraction of the emission spectrum does not include any contribution from the “red” acceptors emission. [1]
PHOTOBLEACHING
Photobleaching of the fluorophores used in an experiment may affect the fluorescence lifetime results. However, as long as the acquisition time scale for measuring the fluorescence lifetime is small compared to the characteristic timescale for photobleaching, the effect of photobleaching on the lifetime determination can be neglected.
Acceptor photo-bleaching is a method widely used for quantifying energy transfer in intensity-based FRET imaging, although it cannot be used for time lapses. In FLIM-based FRET imaging it is very hard to obtain a full recovery of the donor lifetime only after photobleaching the acceptor. In next example [1], the CFP-YFP FRET pair was used; the lifetime of CFP only was 2,5ns and the lifetime of CFP in presence of YFP was1,68ns. After 98% photodestruction of YFP, the lifetime of CFP only increased up to 1,83ns. However, irradiating YFP in the absence of CFP leads to a significant increase in the fluorescence detected in the “CFP” detection channel (up to 28% above background after an 80% photobleaching of YFP). Therefore, it seemed that some photoproducts were created during YFP irradiation, which contributed to fluorescence in the same wavelength ranges than CFP, leading to a contamination of the CFP signal. [1]
AUTOFLUORESCENCE
Media and cells often contain substances that are autofluorescent. Examples are NADH, riboflavins, collagen and lipofuscins [5]. This means that those substances can be excited at the same wavelength as used to excite the fluorophore of interest. Every substance that is excited and emits photons (thus fluorescence) has its own characteristic fluorescence lifetime. The emission of the autofluorescence material mixes with the emission of the fluorophore of interest. If it is not filtered out, it will influence the measured lifetime. To suppress autofluorescence FLIM users generally use phosphate buffered saline (PBS) as medium for the lifetime measurements. One can also use phenol red-free medium.
Frequency domain FLIM can be used to discriminate against autofluorescence, using either the polar (or phasor) plot [6] or a multi-frequency or multi-harmonic FLIM acquisition.
FIXATION
Fixation can also affect fluorescence lifetimes. The important thing is that you need to use the appropriate controls for your experiments. If you are looking for FRET in fixed cells then you need to have donor only and donor + acceptor cells treated under the same conditions. [3]
Various labs use paraformaldehyde (PFA) fixation protocols, methanol fixation and combined methanol/PFA fixation protocols; which protocol to use is mostly determined upon the protein of interest. You should check that the protein localisation is not perturbed by the fixation method and also that the fluorescence is not completely diminished. [3]
MORE FACTORS
There are more factors that should be taken into account. For example, the work of Klaus Suhling [4] shows that the refractive index of the medium can influence the fluorescence lifetime of GFP. Also GFP expressed alone can have a different lifetime to when it is part of a protein construct.
Even temperature can have severe influence on lifetime measurements. Therefore, the temperature of the sample should be kept as stable as possible, e.g. by use of a climate control chamber.
REFERENCES
1. Regis Grailhe, Fabienne Merola, Jacqueline Ridard, Stephen Couvignou, Chantal Le Poupon, Jean-Pierre Changeux, Helene Laguitton-Pasquier. “Monitoring protein interactions in the living cell through the fluorescence decays of the Cyan Fluorescent Protein”, Chemphyschem 7:1442-1454 (2006).
2. D. A. Zacharias, J. D. Violin, A. C. Newton, R. Y. Tsien, Science 296:913-916 (2002).
3. Roland Brock, Irene H.L. Hamelers, and Thomas M. Jovin. “Comparison of Fixation Protocols for Adherent Cultured Cells Applied to a GFP Fusion Protein of the Epidermal Growth Factor Receptor”. Cytometry 35:353-362 (1999).
4. Klaus Suhling, Jan Siegel, David Phillips, Paul M. W. French, Sandrine Leveque-Fort, Stephen E. D. Webb, and Daniel M. Davis. “Imaging the environment of green fluorescent protein”. Biophysical Journal 83:3589-3595 (2002).
5. Billinton N, Knight AW. “Seeing the wood through the trees: a review of techniques for distinguishing green fluorescent protein from endogenous autofluorescence”. Anal Biochem 291(2):175-97 (2001).
6. Stringari, C. et al., PNAS, 108, 33, 13582“Phasor approach to fluorescence lifetime microscopy distinguishes different metabolic states of germ cells in a live tissue” (2011).

5th floor,
Leonard Springerlaan 19
9727KB Groningen
The Netherlands