

In biological research, fluorescent proteins (FPs) are widely used in fluorescence microscopy. FPs are genetically encoded fluorophores, which are produced by cells after a noninvasive transfection. These proteins are utilized as markers and bio-sensors to study biological processes in living cells at high spatial and temporal resolution. Currently, many different types of FPs exist, comprising different spectral properties (i.e. colors), fluorescence lifetime characteristics, photo switching behavior, brightness, pH sensitivity, etc.
New FPs are continuously being developed in order to optimize their properties for specific applications. The fluorescence lifetime is an excellent parameter to use as selection marker in a screening for optimized FPs. The fluorescence lifetime is correlated with the quantum yield and thus the intrinsic brightness. In contrast, the fluorescence intensity is correlated with the brightness and protein concentration. Therefore, when only fluorescence intensity is used for screening, the selection will be biased towards samples with a higher concentration. Also the effects of environment can affect the fluorescence lifetime, e.g. the pH and chloride ions. A main application where the fluorescence lifetime is a key molecular property, is in Förster Resonance Energy Transfer (FRET) based molecular biosensors. Here changes in molecular interactions or conformation can be directly observed by measuring the donor life-time and changes thereof.
We developed a multi-position fluorescence lifetime imaging (FLIM) screening method to screen for bright FPs. However, this method can be applied to any experiment in which the fluorescence lifetime is an important parameter. To be able to test many different FP mutants (samples), an efficient acquisition and data processing workflow is paramount to obtain high quality and reproducible data with high throughput. The LIFA system, with the aid of MATLAB® and ImageJ [1], can be utilized to set up such an automated screening and characterization approach, allowing full flexibility.
Researchers at the University of Amsterdam developed a multi-position fluorescence lifetime imaging (FLIM) screening method to screen for bright FPs. However, this method can be applied to any experiment in which the fluorescence lifetime is an important parameter.
AUTOMATED MULTI-POSITION FLIM ACQUISITION WITH MATLAB
Lambert Instruments has provided a versatile library of interface functions (API) that allows direct communication with the LIFA software via MATLAB, in order to control the LIFA camera (Fig. 1A) and the microscope (Fig. 1B). With the aid of this API, a custom made MATLAB graphical user interface (GUI) was developed that allows multi-position acquisition.
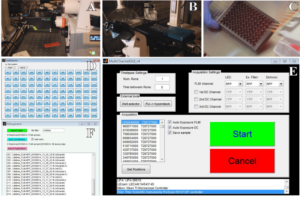
Figure 1. Automated 96-well lifetime acquisition. The LIFA camera (A) and microscope (B) iterate over a 96 well plate (C). Each well can be selected or deselected by using the well selector (D). The selected coordinates are loaded into the MATLAB GUI and specific excitation and emission filters can be selected together with auto-exposure and output file settings (E). Finally, lifetime files (fli) are exported to a large TIF hyperstack (F) for further processing with ImageJ.
In this example, each well in a 96-well plate contains mammalian cells transfected with DNA encoding a different FP (Fig. 1C). Prior to the multi-position acquisition, specific wells can be selected or deselected by using a secondary MATLAB GUI (Fig. 1D). After this, a text file and an Excel file are exported, both only containing the selected wells. The Excel file comprises the well names, the well coordinates and also contains a column where the user can add metadata about each well (e.g. name of FP).
Before acquisition is started, it is possible to set other parameters within the LIFA software and to acquire a calibration lifetime measurement. Furthermore, options to use auto-exposure and to choose the type of output files that will be stored for later processing are present (i.e. calculated lifetime images, raw phase images or DC images) (Fig. 1E). After the coordinate file is loaded and acquisition is commenced, the MATLAB script iterates over all coordinates, taking phase stacks and storing the selected output files. Each lifetime file (.fli) comprises four channels, including lifetime data and the fluorescence intensity data. The files also contain metadata about the position, exposure time and reference lifetime. Using another secondary custom made MATLAB GUI, all the fli-files are imported using the Bio-Formats [2] package for MATLAB and the image data and metadata are extracted. Subsequently, all the raw images are exported to an ImageJ TIF hyperstack (Fig. 1F) that can be directly processed with ImageJ. The reference lifetime, the exposure time for each well as well as the information previously stored in the Excel file are added to the metadata for later use. This helps the user to keep track of the wells and their metadata during processing.
DATA PROCESSING AND VISUALIZATION USING IMAGEJ
In order to process the large quantities of lifetime data, several ImageJ macros were written that can be easily operated by any user. The user sets several parameters before processing, including smoothing and also thresholding (Fig. 2A). The macro generates three files: an ImageJ TIF stack (Fig. 2B), a 96-well layout figure (Fig. 2C), and a numerical table. The 96-well layout displays the mean phase lifetime, mean modulation lifetime and mean intensity of all wells and will therefore quickly indicate the wells of interest. Each multi-panel FLIM figure of the ImageJ TIF stack gives a detailed FLIM analysis per well. The multi-panel FLIM figure (Fig. 2D) displays the intensity image in grayscale (I) and the following panels for the phase and modulation lifetimes: a false color image (II), a false color image with intensity overlay (III), a lifetime histogram (IV), a scatterplot of the lifetime versus the intensity (V). Finally, the polar plot (VI) is shown together with the scatterplot of phase versus modulation lifetime (VII). In addition, each multi-panel FLIM figure also includes metadata i.e. the exposure time, well number, the user added metadata, and the original file name.
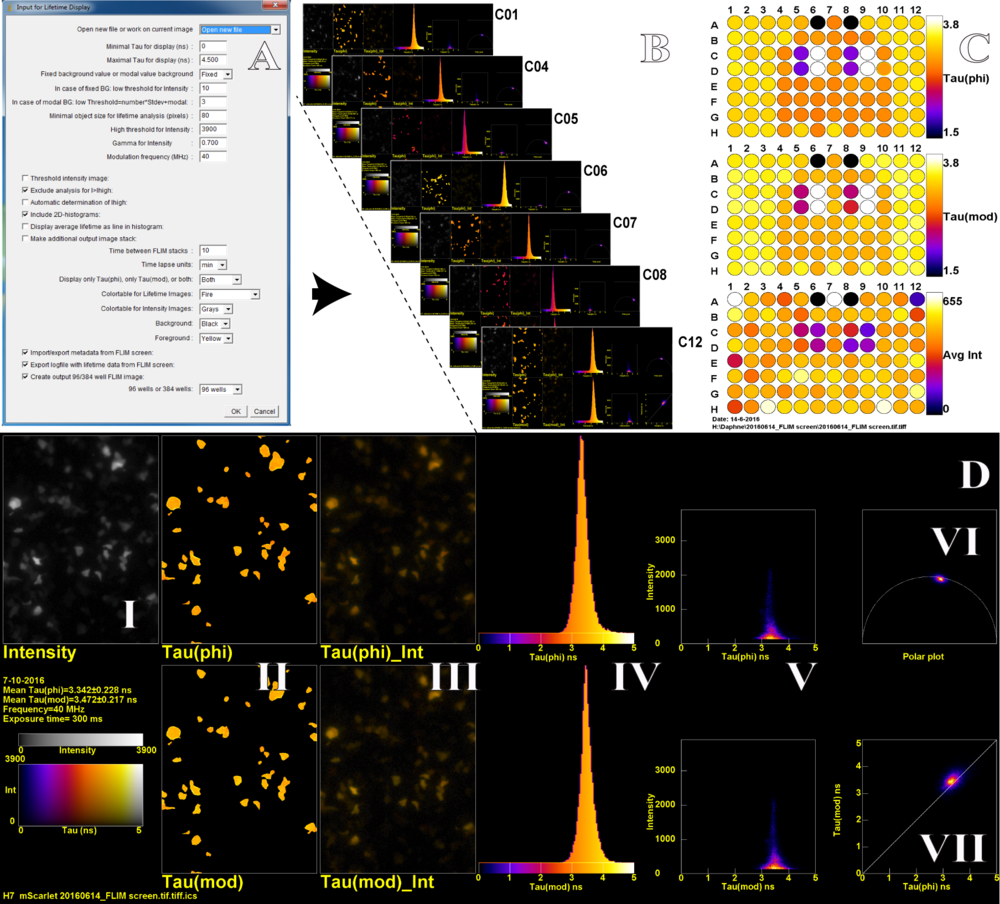
Figure 2. An ImageJ macro (A) allows to set several processing and display parameters and generates a TIF stack with display figures for all wells present in the hyperstack (B) and a 96-well layout with the mean lifetime data (C). A detailed FLIM analysis from one well (D), the TIF stack (B) containing an extensive FLIM analysis of each well. The multi-panel D contains: grayscale (I), lifetime false color images (II), lifetime false color image with intensity overlay (III), a lifetime histogram (IV), a scatterplot of the lifetime versus the intensity (V), the polar plot (VI) and a scatterplot of phase (phi) versus modulation (mod) lifetime (VII).
The wells in Figure 2 are measurements of newly developed mScarlet red FP variants [3] in mammalian cells. The measurements are highly reproducible; in figure 2 only 4 variants have been used and only 4 colors appear in the phase and modulation lay-out in figure 2C. The lifetime histograms (Fig. 2D IV) of different wells that are transfected with the same FP are very similar. The width of the histograms mainly reflects the variability across cells, and is much narrower for measurements performed on solutions with purified FPs. By using this approach we found a monomeric red FP variant, named mScarlet, with the highest fluorescence lifetime and quantum yield up to date. As mentioned before, this pipeline can also be utilized for other screening and characterization applications where fluorescence lifetime is an important readout, for example optimization of FRET based biosensors, testing of agonist and antagonist dose dependency and pH sensitivity of fluorescent proteins. Taken together, using this pipeline, it is possible to screen many constructs and conditions in a fast automated and user-friendly way, yielding robust and highly reproducible results.
ACKNOWLEDGEMENTS
Lambert Instruments (Johan Herz MATLAB API scripting), NWO-STW grant 12149, NWO CW-Echo grant 711.01.01812, NWO ALW-VIDI grant 864.09.015 and Nikon Netherlands
REFERENCES
1. Schneider, C. A.; Rasband, W. S. & Eliceiri, K. W. (2012), NIH Image to ImageJ: 25 years of image analysis, Nature methods 9(7): 671-675.
2. Melissa Linkert, Curtis T. Rueden, Chris Allan, Jean-Marie Burel, Will Moore, Andrew Patterson, Brian Loranger, Josh Moore, Carlos Neves, Donald MacDonald, Aleksandra Tarkowska, Caitlin Sticco, Emma Hill, Mike Rossner, Kevin W. Eliceiri, and Jason R. Swedlow (2010) Metadata matters: access to image data in the real world. The Journal of Cell Biology, Vol. 189no. 5777-782.
3. Daphne S. Bindels, Lindsay Haarbosch, Laura van Weeren, Marten Postma, Katrin E Wiese, Marieke Mastop, Sylvain Aumonier, Guillaume Gotthard, Antoine Royant, Mark A. Hink and Theodorus W.J. Gadella Jr. mScarlet: a novel bright monomeric red fluorescent protein for cellular imaging. Nature Methods (2016)

5th floor,
Leonard Springerlaan 19
9727KB Groningen
The Netherlands