

Forster Resonance Energy Transfer (FRET) is the non-radiative transfer of energy from a molecule in the excited state (donor) to a molecule in the ground state (acceptor). A fluorescent donor molecule can return to the ground state by losing its energy through emission of a photon (fluorescence), or by transferring its energy to a nearby (1 – 9nm) acceptor molecule (FRET). Compared to a molecule that exhibits no FRET, the donor has more options to lose its energy. Therefore, it returns faster to the ground state, which decreases its lifetime.
FRET is a useful tool to quantify molecular dynamics like interactions of two fluorophores by microscopy. The proteins under investigation are labelled with donor fluorophores or acceptor fluorophores. Interaction between the two fluorophores is accompanied by direct energy transfer from donor to acceptor (FRET). When FRET occurs, it means that the two proteins of interest are in such close proximity that they can interact with each other.
During FRET, a quantum of energy is transferred from a donor fluorophore to an acceptor fluorophore in a nonradiative process. So, in case of no FRET, the donor fluorophore is excited and emits photons. The acceptor fluorophore does not emit photons, because it is not excited. In case of FRET, the donor fluorophore is excited, but in stead of emitting all its energy as photons, it transfers some of its energy to the acceptor fluorophore that becomes excited and emits light.
Summarising, in case of no FRET only the donor fluorophore emits photons, and in case of FRET both donor and acceptor emit photons.
FRET ONLY OCCURS IF…
The donor fluorescence emission spectrum overlaps with the acceptor absorbance.
The donor and acceptor fluorophores are in close proximity (i.e. 1 – 9nm, which is at the scale of protein size).
The transition dipole moments of the donor and acceptor fluorophores are not perpendicular.
FRET PAIRS
To let FRET occur, the emission spectrum of the donor fluorophore has to overlap the excitation spectrum (absorbance) of the acceptor fluorophore. Some examples are BFP-YFP, CFP-YFP, GFP-DsRed, GFP-Cy3, GFP-mOrange, YFP-RFP, and Cy3-Cy5.
Browser based calculator to find the critical distance and FRET efficiency with known spectral overlap.
A selection of papers and books that describe the technology of Forster Resonance Energy Transfer (FRET) in more detail:
BOOKS / REVIEWS:
Gadella TW Jr., FRET and FLIM techniques, 33. Elsevier, ISBN-13: 978-0080549583. (Dec 2008) 560 pages. Elsevier link
Periasamy, A & Clegg RM, FLIM Microscopy in Biology and Medicine. Chapman & Hall/CRC, 1st edition, ISBN-13: 978-1420078909. (Jul 2009) 368 pages. Amazon link
Lakowicz JR. Principles of fluorescence spectroscopy, 3rd edition, ISBN-13: 978-0387312781 . Springer, 3rd edition (Sep 2006) 954 pages. Amazon link
Van Munster EB, Gadella TW Jr. Fluorescence lifetime imaging microscopy (FLIM). Review. Adv Biochem Eng Biotechnol. (2005) 95:143-75. Pubmed link
BOOKS; FLUORESCENT PROTEINS / CELL BIOLOGY:
Sullivan KF, Fluorescent Proteins, 2nd Edition Volume 85. Academic Press, ISBN-13: 978-0123725585. (Dec 2007) 660 pages. Elsevier link
Sullivan KF, Kay SA, Wilson L, Matsudaira PT,Green Fluorescent Proteins, Volume 58. Academic Press, ISBN-13: 978-0126760750. (1998) 386 pages. Elsevier link (mmm)
PAPER MULTIFREQUENCY:
Squire A, Verveer PJ, Bastiaens PIH, Multiple frequency Fluorescence lifetime imaging microscopy. Journal of Microscopy, (2000) 197(2):136-149. Pubmed link
PAPER PHASE STEP ORDER:
Van Munster EB, Gadella TW Jr, Suppression of photobleaching-induced artifacts in frequency-domain FLIM by permutation of the recording order. Cytometry A. (2004) 58(2):185-94. Pubmed link
PAPERS POLAR PLOT:
Redford GI, Clegg RM, Polar plot representation for frequency-domain analysis of fluorescence lifetimes. Journal of Fluorescence (2005) 15(5):805-815. Pubmed link
Clayton AHA, Hanley QS, Verveer PJ. Graphical representation and multicomponent analysis of single-frequency fluorescence lifetime imaging microscopy data. Journal of Microscopy (2004) 213(1):1-5. Pubmed link
PAPERS FLIM-TIRF:
Valdembri D, Caswell PT, Anderson KI, Schwarz JP, König I, Astanina E, Caccavari F, Norman JC, Humphries MJ, Bussolino F, Serini G, Neuropilin-1/GIPC1 signaling regulates alpha5beta1 integrin traffic and function in endothelial cells. PLoS Biol. (2009) 27:7(1):e25. Full text
A paper describing the Lambert Instruments FLIM Attachment in TIRF mode, performed at the Beatson Institute for Cancer Research in Glasgow.
Cell biology is the discipline that studies cells to answer scientific questions. All organisms are composed of one or more cells and all vital functions of an organism occur within cells. Cells contain the hereditary information necessary for regulating cell functions. Cells possess DNA, the hereditary material of genes, and RNA, containing the information necessary to build various proteins such as enzymes, the cell’s primary machinery. There are also other kinds of biomolecules in cells, e.g. lipids, proteins, macromolecules, and more.
Cell biology research includes learning the physiological properties such as the structure and the organelles of cells, their environment, interactions, life cycle, division, function, and eventual death. This is done both on microscopic and molecular level, and includes the research of single-celled organisms like bacteria as well as specialized cells in multi-cellular organisms like humans.
Knowing the composition of cells and how cells work is fundamental to all of the biological sciences. Appreciating the similarities and differences between cell types is particularly important to the fields of cell and molecular biology. These fundamental similarities and differences provide a unifying theme, allowing the principles learned from studying one cell type to be extrapolated and generalized to other cell types.
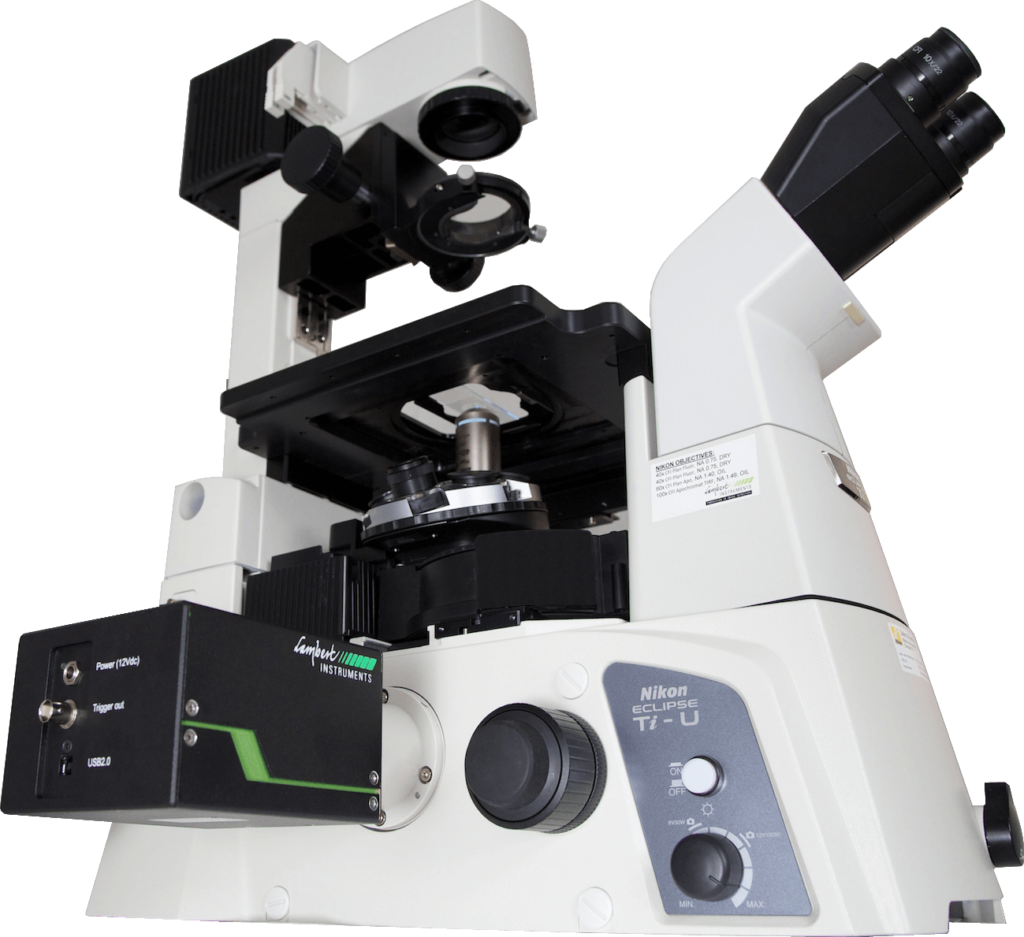
In combination with our products, wide field fluorescence microscopy is used to measure characteristics of fluorescent proteins. Cells, originating from bacteria and insects to mammals, generally are kept in culture and plated at coverslips to do specific experiments. Microscopy enables viewing objects inside cells that are stained or fluorescently tagged. By observing the characteristics, e.g. the fluorescence lifetime, of the fluorescent compounds, not just the localization of a fluorescent protein, but also the characteristics of its local environment can be imaged. Novel multi-parameter fluorescence imaging systems are being used to study intracellular organization and inter- and intracellular signalling.
One way to observe the proteins, is by fixation of the cells to the coverslips. Before the cells are fixed, the compounds in the cells can be fluorescently tagged (see living cell-imaging). Also, the compounds inside the cells can be stained after their fixation, for example by use of antibodies. Staining is a biochemical technique of adding a class-specific (DNA, proteins, lipids or carbohydrates) dye to a substrate to qualify or quantify the presence of a specific compound. The characteristics of the dyes can give answers to specific scientific questions, like whether there is interaction between two different proteins, whether there is a conformational change of the protein after a kind of treatment (see also Fluorescence Lifetime Imaging Microscopy and Forster Resonance Energy Transfer), or whether specific ions have bound to the proteins of interest, etc.
The cells can also be analyzed in-vivo. These living cell imaging experiments seek to gain information about the localization and interaction of the desired protein. One way to do this is to replace the wild-type gene with a ‘fusion’ gene that has a reporting element such as GFP. That will allow easy visualization of the products of the genetic modification. More sophisticated techniques are in development that can track protein products without mitigating their function, such as the addition of small sequences which will serve as binding motifs to monoclonal antibodies.
For ion imaging, several fluorescent indicators (sensor, construct, tracer, etc) are available that have a change in quantum yield upon ion binding. This means that they emit photons with different energy, thus have different emission wavelength. Their fluorescence lifetime could also change. Therefore, there are two methods in which ion imaging can be done by use of indicators: the ratiometric method and the FLIM method.
Another method ion imaging is by the use of Forster Resonance Energy Transfer based (FRET-based) indicators that change their conformation upon ion binding. Upon the conformational change of a FRET-based indicator, its FRET efficiency changes, which is used as indicator of ion concentration. Examples of these indicators are cameleons. Cameleons are genetically-encoded fluorescent indicators for Ca2+ based on green fluorescent protein variants and calmodulin (CaM).
Reference: Miyawaki A, Griesbeck O, Heim R, Tsien RY. “Dynamic and quantitative Ca2+ measurements using improved cameleons”. Proc Natl Acad Sci USA (PNAS) 96(5):2135-40 (1999)
CALCIUM IMAGING
Calcium (Ca2+) is important for signal transduction pathways.
PROTON (PH) IMAGING
The intracellular proton (H+) concentration (pH), as well as intracellular calcium, is important in the regulation of cellular functions including growth, differentiation, motility, exocytosis and endocytosis. To study this in more detail, measurements of the intracellular pH of resting cells can be done and the pH fluctuations inside cells after environmental perturbations can be followed.
Reference: Hai-Jui Lin, Petr Herman, and Joseph R. Lakowicz. “Fluorescence Lifetime-Resolved pH Imaging of Living Cells”. Cytometry Part A 52A:77–89 (2003).
Demonstration of the Lambert Instruments Toggel camera for single-image FLIM (siFLIM) detection of histamine-induced alterations in Ca2+ concentration. Tiny oscillations in Ca2+ levels (~2.5 s periods) are observed after addition of histamine. Such small and rapid transients would go completely unnoticed when recorded by conventional FLIM.
Video courtesy of the Netherlands Cancer Institute.
CALCIUM IMAGING
Calcium (Ca2+) is important for signal transduction pathways.
PROTON (PH) IMAGING
The intracellular proton (H+) concentration (pH), as well as intracellular calcium, is important in the regulation of cellular functions including growth, differentiation, motility, exocytosis and endocytosis. To study this in more detail, measurements of the intracellular pH of resting cells can be done and the pH fluctuations inside cells after environmental perturbations can be followed.
Reference: Hai-Jui Lin, Petr Herman, and Joseph R. Lakowicz. “Fluorescence Lifetime-Resolved pH Imaging of Living Cells”. Cytometry Part A 52A:77–89 (2003).
ZINC IMAGING
Zinc (Zn2+) is involved in enzyme catalysis, protein structure, protein-protein interactions, and protein-oligonucleotide interactions. Zinc interacts with extracellular binding sites, which are likely to include binding sites involved in the subsequent translocation of this ion to the cell interior. Inside the cell, Zinc binds to cytosolic and organelle binding sites or is taken up by intracellular organelles.
SODIUM IMAGING
Sodium (Na+) is important in the signal transduction in the central nerve system.
MAGNESIUM IMAGING
Many enzymes (like kinases) require the presence of magnesium Mg2+ ions for their catalytic action, especially enzymes utilising ATP.
CHLORIDE IMAGING
Chloride (Cl-) plays a role in the central nervous system.
POTASSIUM
Potassium (K+) plays a role in cell growth and cell viability.
INDICATORS FOR ION IMAGING BY FLIM
BCECF (pH)
Bis-BTC (heavy metals)
Calcium-crimson (Calcium, orange excitation)
Calcium-green (Calcium, blue excitation)
Carboxyfluorescein (pH)
Carboxy-SNAFL-1 (pH)
Carboxy-SNAFL-2 (cytosol pH)
DM-NERF dextrans (lysosoml pH)
Fluo-3 (Calcium)
Fura-2 (Calcium)
LysoSensor DND-160 (lysosomal pH)
LysoSensor probe (pH)
Magnesium-green (Magnesium)
Mag-quin-1 (Magnesium)
Mag-quin-2 (Magnesium)
MQAE (Chloride)
Newport Green DCF (Zinc)
OG-514 carboxylic acid dextrans (lysosoml pH)
PBFI (Potassium)
Quin-2 (Calcium, blue excitation)
SPQ (Chloride)
Fluorescence Lifetime Imaging Microscopy Forster Resonance Energy Transfer (FLIM-FRET) has a lot of advantages over other FRET detection techniques. A major advantage is that FLIM-FRET measurements are more robust and quantitative than the FRET measurements done by, for example, sensitised emission FRET. Another advantage is that only the lifetime of the donor fluorophore has to be measured; steps to determine acceptor lifetimes are not needed. The acceptor fluorophore may therefore have an inefficient emission, or even may be a quencher, and still good quality FRET-data can be retrieved. This makes the FLIM-FRET method more versatile, faster, and easier. Furthermore, no corrections are needed for donor fluorophore emission bleed through in the acceptor emission channel.
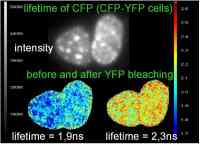
Acceptor Photobleaching
When photobleaching the acceptor fluorophore during FRET, the non-radiative transfer of energy from the donor to the acceptor decreases. The donor fluorophore, in its turn, loses less energy and its fluorescence lifetime, with respect to FRET without a photobleached acceptor. Only when the acceptor is bleached completely, the lifetime of the donor fluorophore will be similar to the situation of no FRET occurrence (a donor-only situation).
Enhanced acceptor Flourescence (EAF)
In the case where the donor and acceptor fluorophores are both excited with the same excitation light wavelength, e.g. in the FRET pair GFP-YFP, a special kind of FRET can be detected. Namely, the average lifetime that is calculated is the contribution of both donor and acceptor fluorophores. Taking GFP and YFP as an example, GFP has a small lifetime compared to YFP. When no FRET is occurring, the average lifetime is measured of both GFP and YFP that are both excited by the 480nm wavelength light source. However, when FRET occurs, the energy of the GFP proteins transfers non-radiatively to the YFP proteins, so relatively more YFP emission (with a long lifetime) is taken into account. So, the average lifetime increases instead of decreases, as is normally the case when you measure only the lifetime of the donor fluorophore.
Forster Resonance Energy Transfer (FRET) efficiency E indicates the percentage of the excitation photons that contribute to FRET and is defined as:
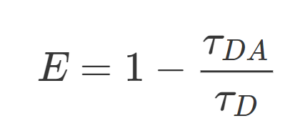
where τDA is the fluorescence lifetime of the donor in the presence of an acceptor, and τD in the abscence of an acceptor. As you can see, the more FRET occurs, the more decrease in donor fluorescence lifetime.
FRET strongly depends on the distance between the donor and acceptor fluorophores (sixth-power relationship). Fluorescence lifetime of a fluorescent molecule is inversely proportional to its FRET efficiency, thus the higher the FRET efficiency the lower the fluorescence lifetime of the donor molecule will be.
The efficiency also depends on the donor-to-acceptor separation distance R with an inverse 6th order law due to the dipole-dipole coupling mechanism:
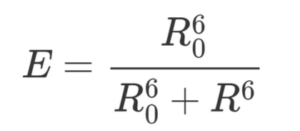
with R being the distance between donor and acceptor pair and R0 being the Förster distance between donor and acceptor at which the FRET efficiency is 50%.
FRET efficiency in a single pixel of an image, does not give exact conclusions about the interactions between fluorophores. The entire 2D image gives a better overview of the interactions that occur. For example: in case of 50% FRET efficiency in a single pixel, it could be possible that 50% of the donor fluorophores have had 100% energy transfer to acceptor fluorophores, but it also could be possible that 100% of the donor fluorophores have had 50% energy transfer to acceptor fluorophores.
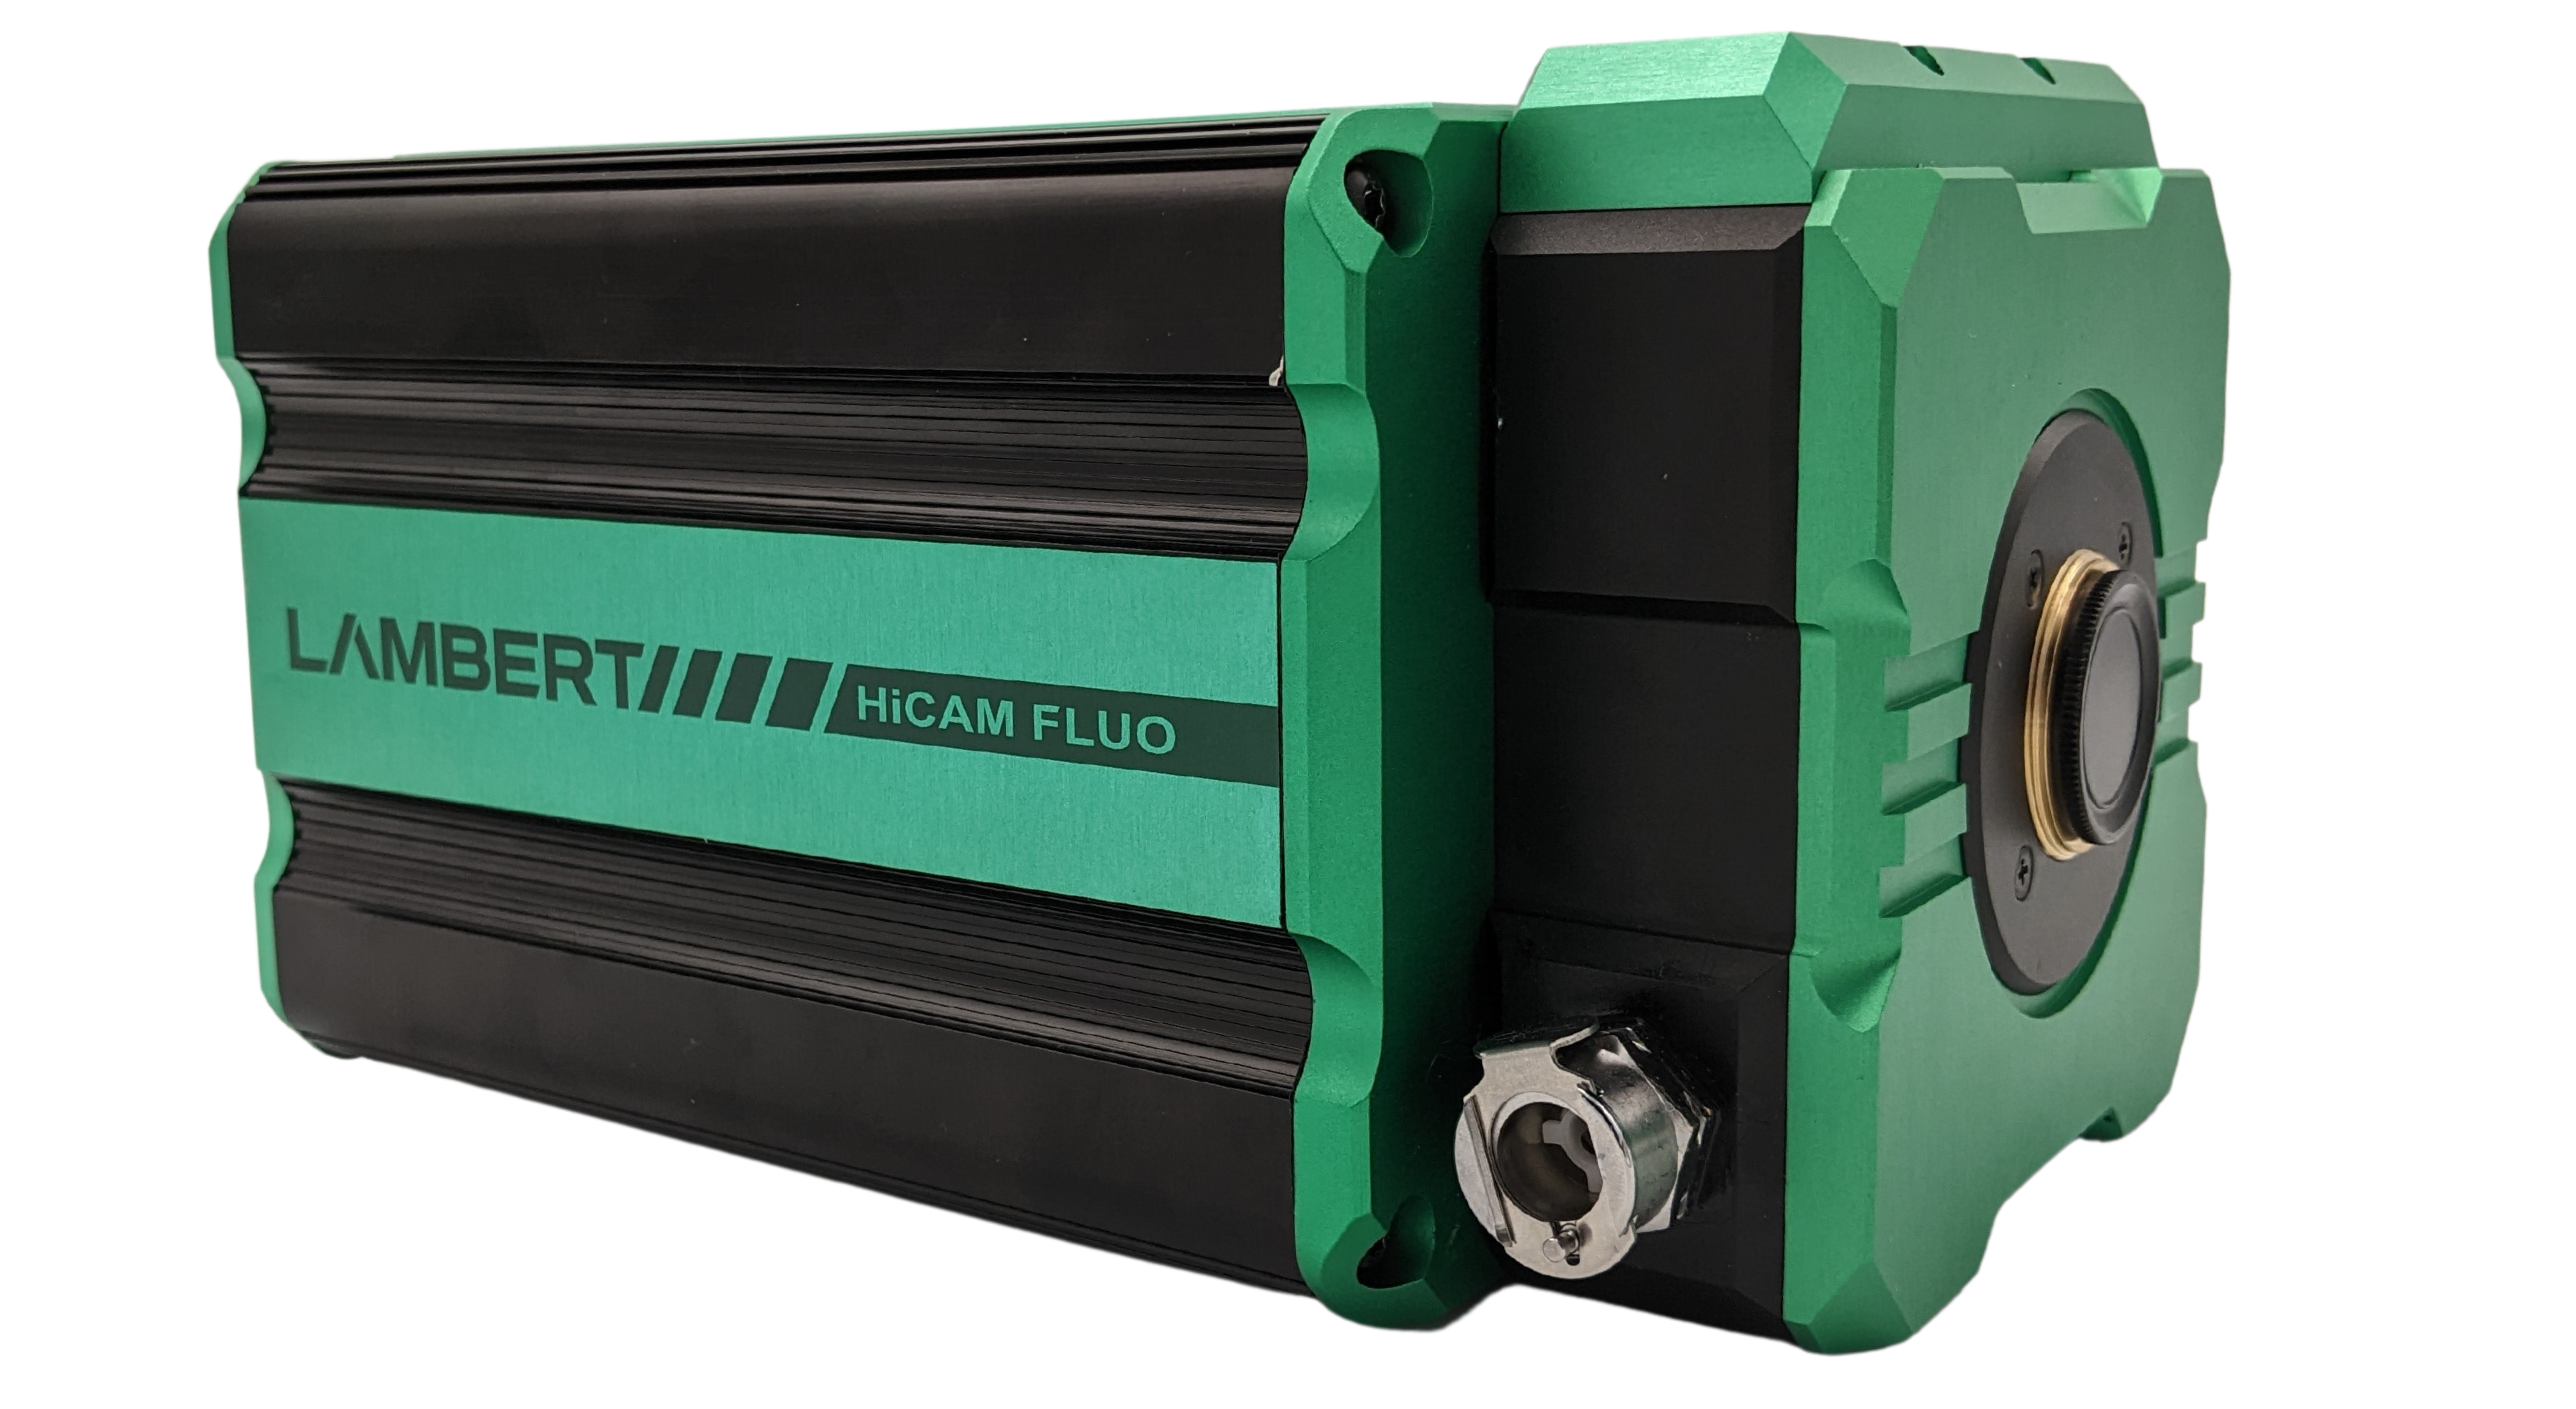
The HiCAM Fluo is a high-speed camera for fluorescence imaging applications. It records high resolution images at a frame rate of up to 2000 fps in the most challenging low-light conditions by using a cooled image intensifier. Packed into a compact aluminum enclosure, it is easy to attach the HiCAM Fluo to any fluorescence microscope.
View Product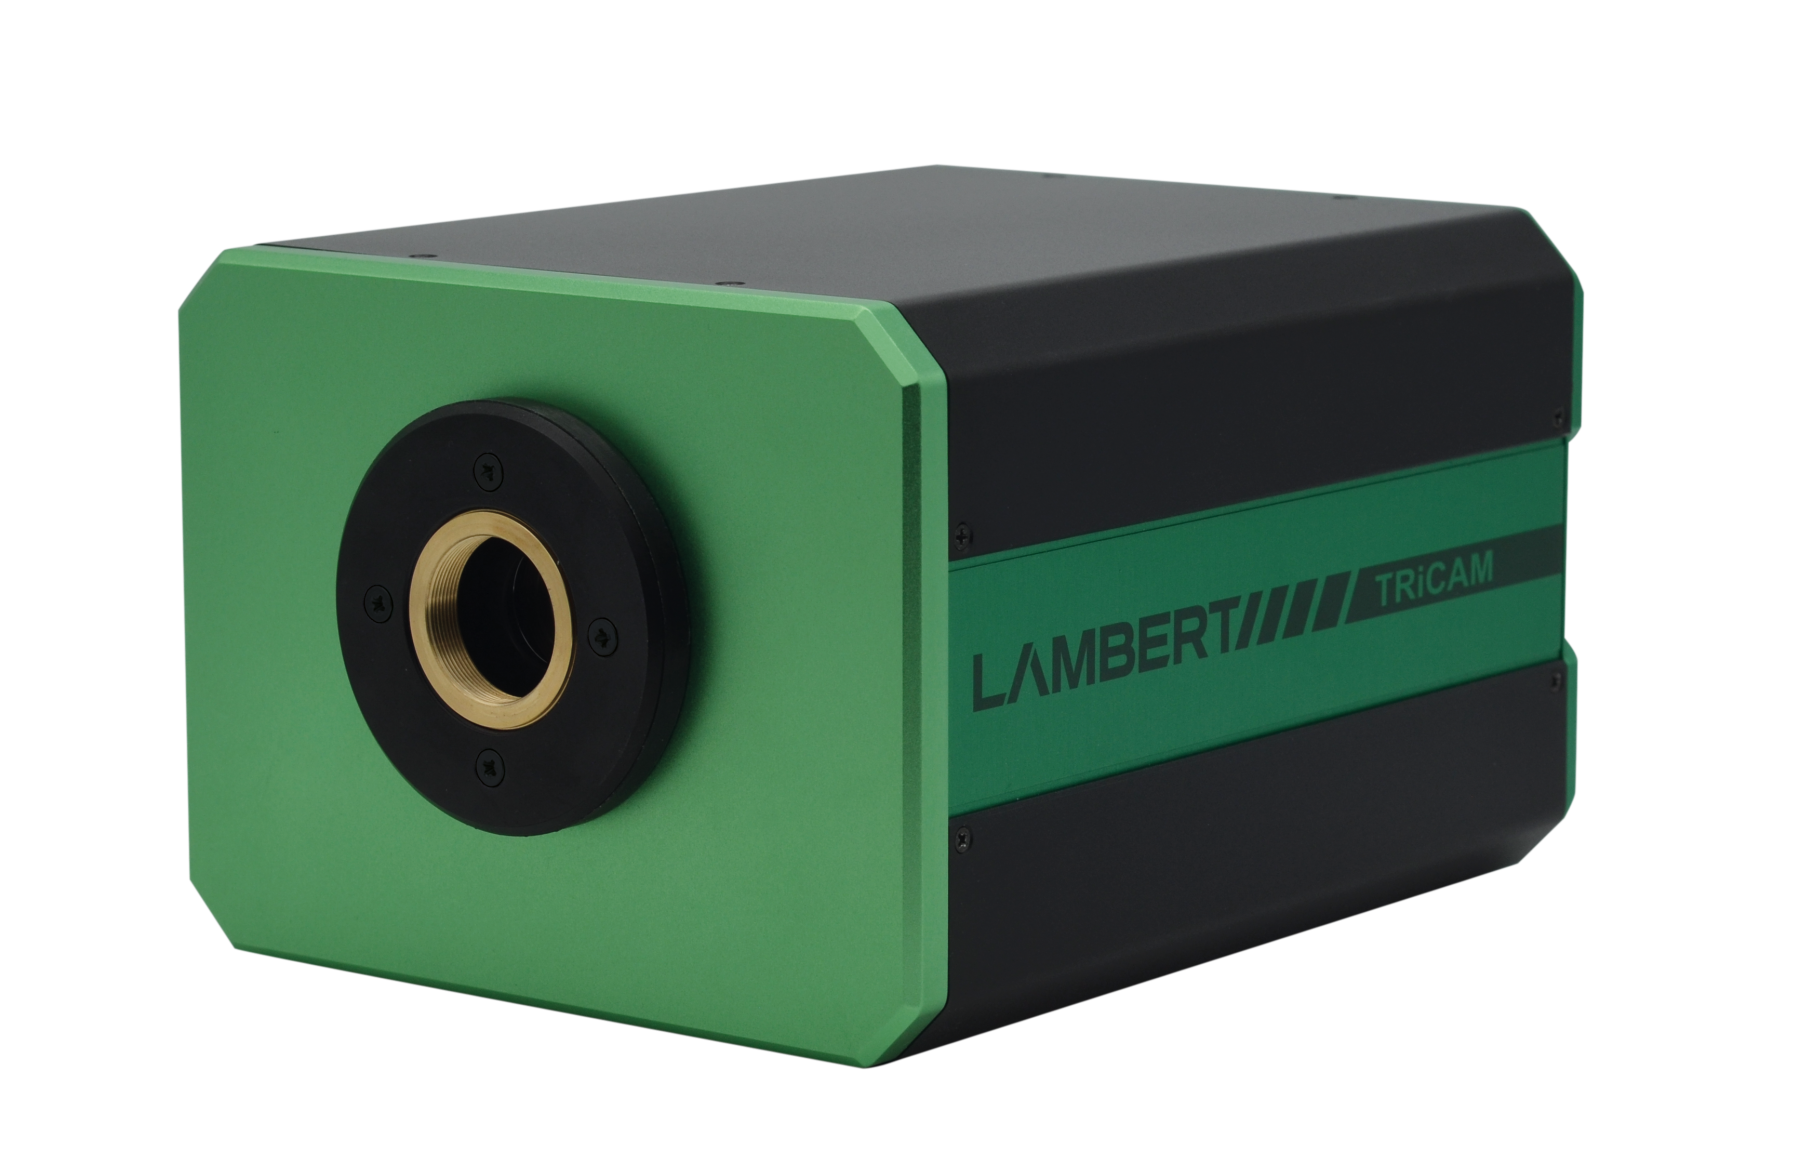
The TRiCAM is a compact intensified camera. It is designed for scientific and industrial applications that require low-light imaging. With built-in signal generators, the TRiCAM is capable of ultra-short exposures through fast gating and therefore suitable for time-resolved imaging.
View Product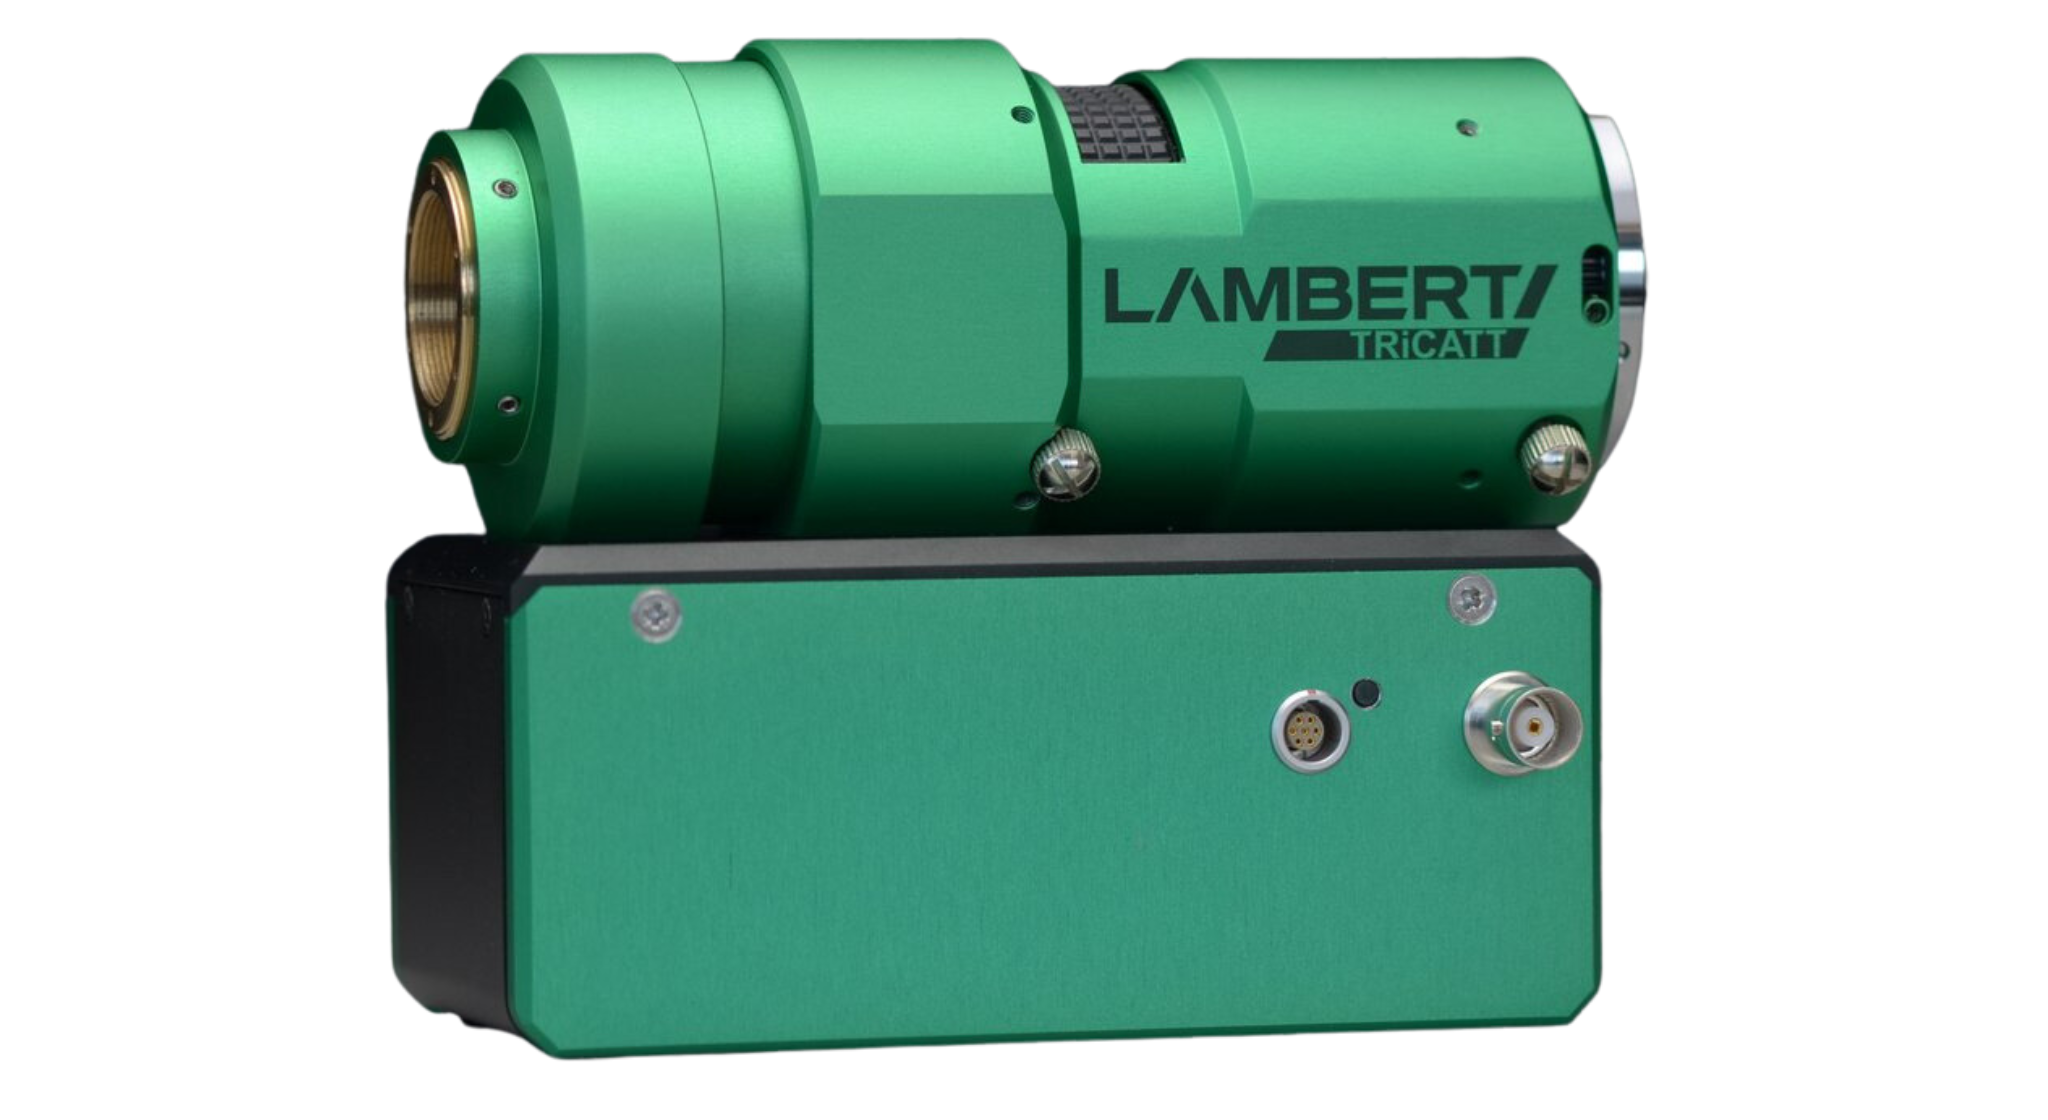
The TRiCATT is a compact lens-coupled image intensifier for scientific and industrial applications that require: – Low-light level imaging – Ultra-short exposures through fast gating – Frequency-domain imaging using lock-in detection Any camera with C-mount and a 1/2″, 2/3″, or 1″ image sensor is compatible with the TRiCATT. You can find the right TRiCATT for your camera with our interactive calculator.
View ProductIn the intensity-based Forster Resonance Energy Transfer (FRET) method, change in emission intensities from donor and acceptor fluorophores is measured. During FRET, the amount of emitted photons (emission intensity) from the donor fluorophore decreases and the emission intensity from the acceptor fluorophore increases. The FRET efficiency is basically calculated from the ratio of emission intensities from donor and acceptor before and after FRET occurrence.
To obtain accurate FRET data by sensitized emission, three images have to be acquired:
1. Donor excitation with donor emission,
2. Donor excitation with acceptor emission,
3. Acceptor excitation with acceptor emission.
The major advantage of this method over fluorescence lifetime imaging microscopy (FLIM)—which is a donor-based FRET detection—is that it can be carried out with standard wide-field or confocal fluorescence microscopes that are available in most laboratories. Moreover, it yields additional data on the acceptor population. However, quantitative sensitized emission requires significant attention for corrections and calibration, whereas FLIM-based FRET techniques are inherently quantitative from first physical principles. [Ref. Gadella TW Jr., FRET and FLIM techniques, 33, 2008]

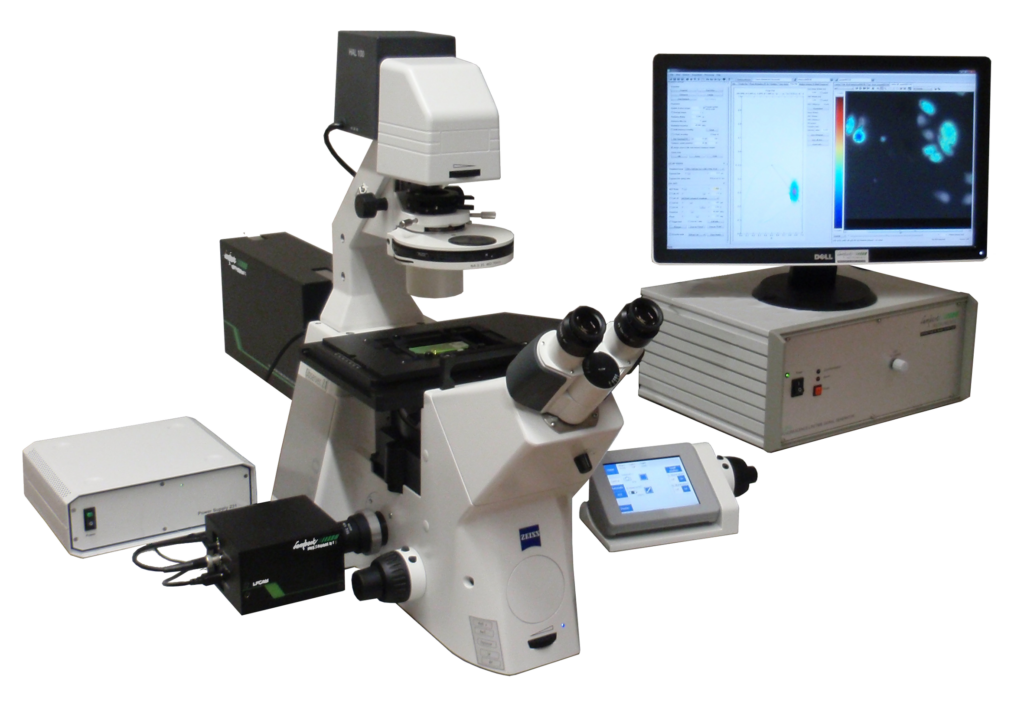
This year marks the 10th anniversary of the LIFA. With the first Lambert Instruments FLIM Attachment (LIFA) a decade ago, we introduced an easy and fast approach to fluorescence lifetime imaging. Since then, we advanced our imaging and analysis software; we improved our hardware and made it more compact; and we added compatibility with third-party hardware. But at the heart of the LIFA experience are still the features that matter most to our users. They are using the LIFA every day, because it is the easiest and fastest system for fluorescence lifetime imaging microscopy.
We visited Dr. Kees Jalink of the Biophysics of Cell Signaling group at the Netherlands Cancer Institute. His research group purchased the first ever LIFA to leave the labs of Lambert Instruments. Ten years later, the LIFA is still their fluorescence lifetime imaging method of choice for studying signal transduction pathways in living cells.
“Cancer can only be truely understood by knowing it in great detail,” says Jalink, “that is, by knowing exactly where and when signal transduction pathways become activated. Tools to study signals must yield data with spatial and temporal detail from living cells, preferably from cells that are as much as possible in a natural environment.”
“We use FRET sensors to study living cells. So for us, some of the other fluorescence lifetime imaging methods are just unacceptably slow. Our researchers are always in a hurry, because the cells they want to study expire within a couple of hours. The LIFA allows us to quickly record fluorescence lifetime images and immediately see a visualization of the results. It is the only way to quickly gather quantitative FLIM data.”
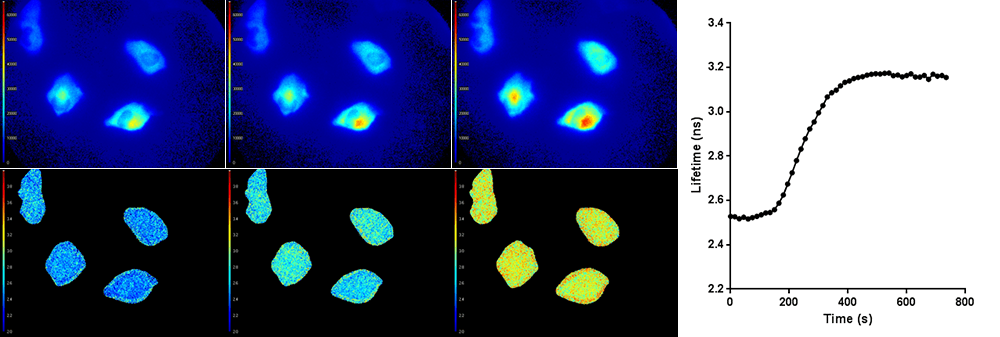
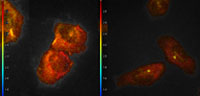
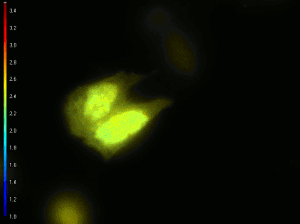
Top row: Light intensity images (colorized). Bottom row: Corresponding fluorescence lifetime images (colorized). The average fluorescence lifetime of the cells increases over time, as shown in the graph on the right.
All researchers and students in Jalink’s group are trained to work with the LIFA to analyze their cells. “After an introduction of about 30 minutes, everybody can work with the system. It’s a simple procedure and that’s why we use the LIFA nearly every day.”
More Information
Lambert Instruments has been shipping the LIFA to cancer research facilities all over the world for years. We are hopeful that we have facilitated a major advance in cancer research. If you are in this field of research, please contact us if you have any questions about the LIFA.
Publications
Over the years, many researchers have published the results of experiments they performed with the LIFA. We have compiled an overview of LIFA publications, as well as a number of application notes that illustrate some of its many applications.

5th floor,
Leonard Springerlaan 19
9727KB Groningen
The Netherlands